Estimating population parameters from sample parameters is one of the major applications of inferential statistics.

Here, we present how to calculate the minimum sample size needed to estimate a population mean (
Point estimation involves the use of sample data to calculate a single value which serves as the "best estimate" of an unknown population parameter.
Interval estimation is the use of sample data to calculate an interval of possible (or probable) values of an unknown population parameter.
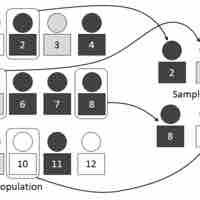
In order to estimate a population proportion of some attribute, it is helpful to rely on the proportions observed within a sample of the population.
The problem of comparing more than two means results from the increase in Type I error that occurs when statistical tests are used repeatedly.
Completely randomized designs study the effects of one primary factor without the need to take other nuisance variables into account.
ANOVA is useful in the multiple comparisons of means due to its reduction in the Type I error rate.
Block design is the arranging of experimental units into groups (blocks) that are similar to one another, to control for certain factors.
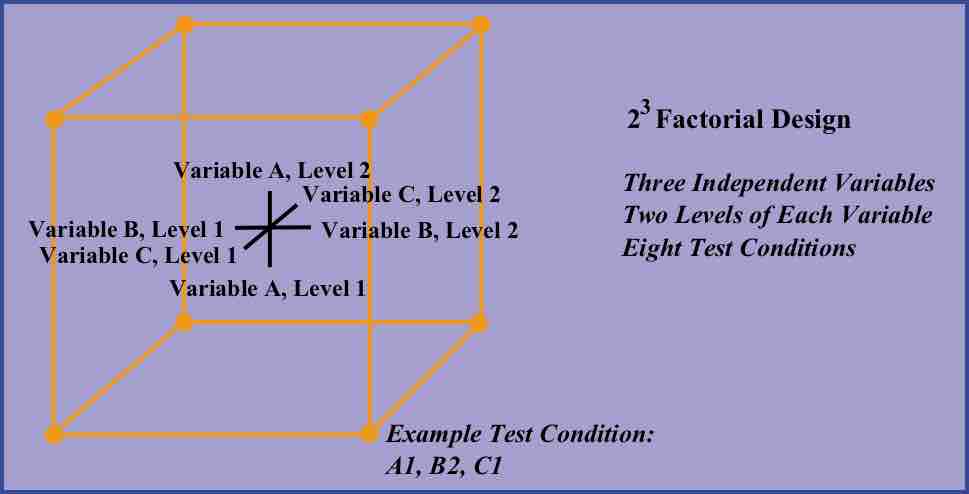
A full factorial experiment is an experiment whose design consists of two or more factors with discrete possible levels.
A confidence interval is a type of interval estimate of a population parameter and is used to indicate the reliability of an estimate.
For users of frequentist methods, various interpretations of a confidence interval can be given.
Readers of polls, such as the Gallup Poll, should exercise Caveat Emptor by taking into account the poll's margin of error.
The proportion of confidence intervals that contain the true value of a parameter will match the confidence level.
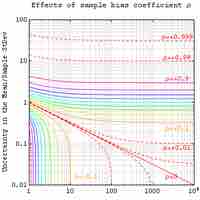
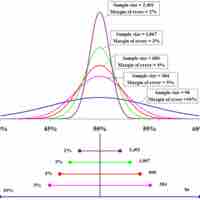
A major factor determining the length of a confidence interval is the size of the sample used in the estimation procedure.
The procedure to find the confidence interval and the confidence level for a proportion is similar to that for the population mean.
In this section, we outline an example of finding the confidence interval for a population mean when we know the standard deviation.
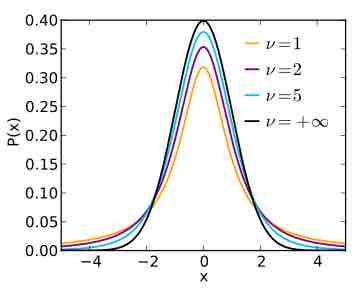
In this section, we outline an example of finding the confidence interval for a population mean when we do not know the standard deviation.
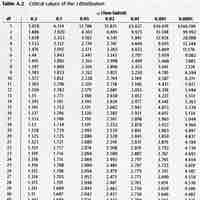
The chi-square distribution is used to construct confidence intervals for a population variance.

Tests of significance are a statistical technology used for ascertaining the likelihood of empirical data, and (from there) for inferring a real effect.
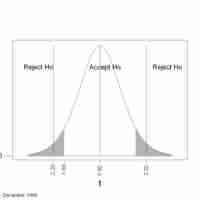
A statistical hypothesis test is a method of making decisions using data from a scientific study.

The alternative hypothesis and the null hypothesis are the two rival hypotheses that are compared by a statistical hypothesis test.

If the result of a hypothesis test does not correspond with reality, then an error has occurred.
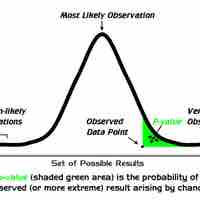
If a test of significance gives a
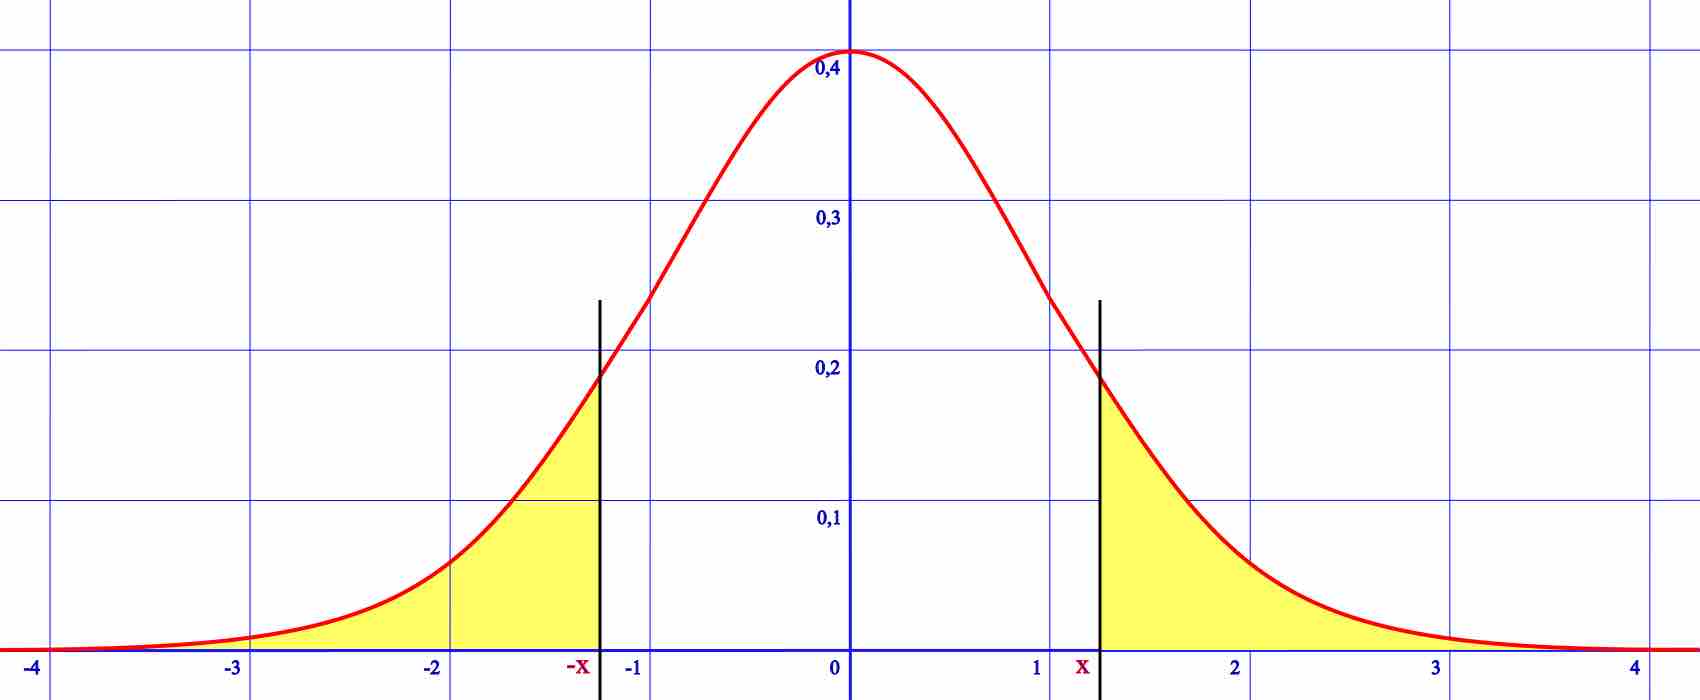
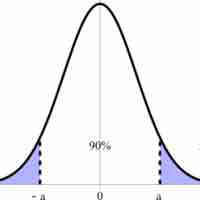
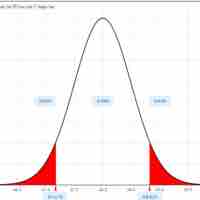
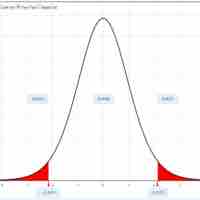
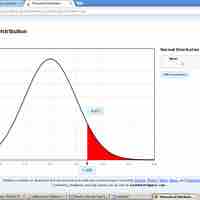
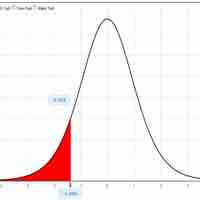
A one-tailed hypothesis is one in which the value of a parameter is either above or equal to a certain value or below or equal to a certain value.
Creating a hypothesis test generally follows a five-step procedure.
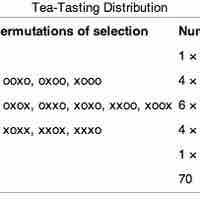
Here we will evaluate an example of hypothesis testing for a single proportion.
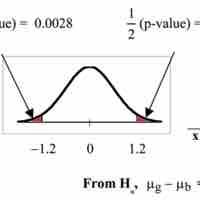
In this section we will evaluate an example of hypothesis testing for a single mean.
In this section we will evaluate an example of hypothesis testing for a single variance.
To compare two means or two proportions, one works with two groups.
To compare independent samples, both populations are normally distributed with the population means and standard deviations unknown.
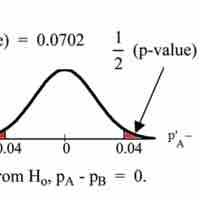
If two estimated proportions are different, it may be due to a difference in the populations or it may be due to chance.
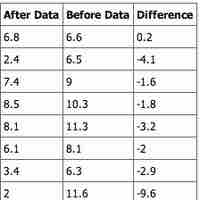
In a hypothesis test for matched or paired samples, subjects are matched in pairs and differences are calculated.
In order to compare two variances, we must use the
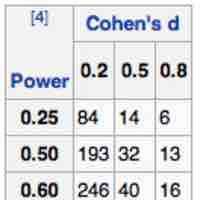
A common problem is calculating the sample size required to yield a certain power for a test, given a predetermined type I error rate
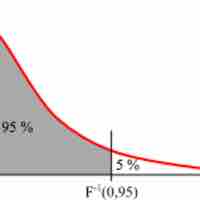
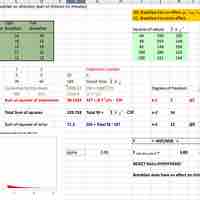
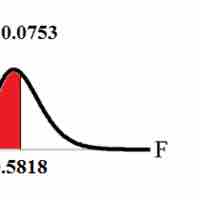
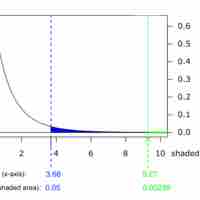
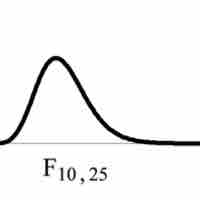
An F-test is any statistical test in which the test statistic has an F-distribution under the null hypothesis.
The
The
Most
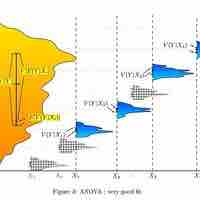
ANOVA is a statistical tool used in several ways to develop and confirm an explanation for the observed data.
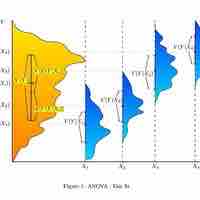
Many statisticians base ANOVA on the design of the experiment, especially on the protocol that specifies the random assignment of treatments to subjects.
The results of a one-way ANOVA can be considered reliable as long as certain assumptions are met.