The creation of a hypothesis test generally follows a five-step procedure as detailed below:
1. Set up or assume a statistical null hypothesis (
-
$H_0$ : Given our sample results, we will be unable to infer a significant correlation between the dependent and independent research variables. -
$H_0$ : It will not be possible to infer any statistically significant mean differences between the treatment and the control groups. -
$H_0$ : We will not be able to infer that this variable's distribution significantly departs from normality.
2. Decide on an appropriate level of significance for assessing results. Conventional levels are 5% (
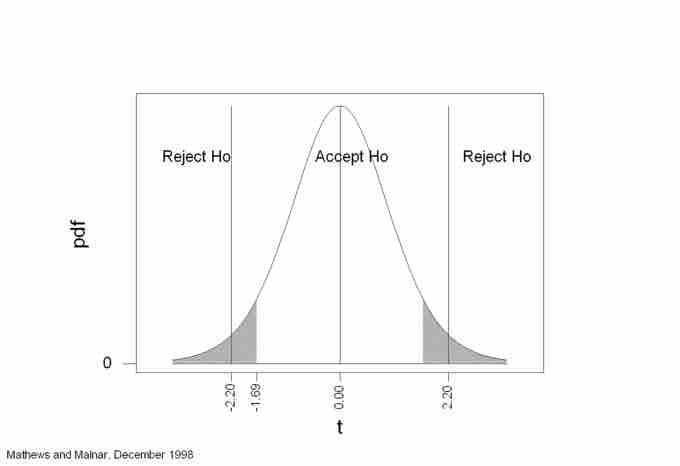
3. Decide between a one-tailed or a two-tailed statistical test. A one-tailed test assesses whether the observed results are either significantly higher or smaller than the null hypothesis, but not both. Thus, one-tailed tests are appropriate when testing that results will only be higher or smaller than null results, or when the only interest is on interventions which will result in higher or smaller outputs. A two-tailed test, on the other hand, assesses both possibilities at once. It achieves so by dividing the total level of significance between both tails, which also implies that it is more difficult to get significant results than with a one-tailed test. Thus, two-tailed tests are appropriate when the direction of the results is not known, or when the researcher wants to check both possibilities in order to prevent making mistakes.

Two-Tailed Statistical Test
This image shows a graph representation of a two-tailed hypothesis test.
4. Interpret results:
- Obtain and report the probability of the data. It is recommended to use the exact probability of the data, that is the '
$p$ -value' (e.g.,$p=0.011$ , or$p=0.51$ ). This exact probability is normally provided together with the pertinent statistic test ($z$ ,$t$ ,$F$ …). -
$p$ -values can be interpreted as the probability of getting the observed or more extreme results under the null hypothesis (e.g.,$p=0.033$ means that 3.3 times in 100, or 1 time in 33, we will obtain the same or more extreme results as normal [or random] fluctuation under the null). -
$p$ -values are considered statistically significant if they are equal to or smaller than the chosen significance level. This is the actual test of significance, as it interprets those$p$ -values falling beyond the threshold as "rare" enough as to deserve attention. - If results are accepted as statistically significant, it can be inferred that the null hypothesis is not explanatory enough for the observed data.
5. Write Up the Report:
- All test statistics and associated exact
$p$ -values can be reported as descriptive statistics, independently of whether they are statistically significant or not. - Significant results can be reported in the line of "either an exceptionally rare chance has occurred, or the theory of random distribution is not true. "
- Significant results can also be reported in the line of "without the treatment I administered, experimental results as extreme as the ones I obtained would occur only about 3 times in 1000. Therefore, I conclude that my treatment has a definite effect.". Further, "this correlation is so extreme that it would only occur about 1 time in 100 (
$p=0.01$ ). Thus, it can be inferred that there is a significant correlation between these variables.