Many statistical applications in psychology, social science, business administration, and the natural sciences involve several groups. For example, an environmentalist is interested in knowing if the average amount of pollution varies in several bodies of water. A sociologist is interested in knowing if the amount of income a person earns varies according to his or her upbringing. A consumer looking for a new car might compare the average gas mileage of several models. For hypothesis tests involving more than two averages, statisticians have developed a method called analysis of variance (abbreviated ANOVA).
ANOVA is a collection of statistical models used to analyze the differences between group means and their associated procedures (such as "variation" among and between groups). In ANOVA setting, the observed variance in a particular variable is partitioned into components attributable to different sources of variation. In its simplest form, ANOVA provides a statistical test of whether or not the means of several groups are equal, and therefore generalizes t-test to more than two groups. Doing multiple two-sample t-tests would result in an increased chance of committing a type I error. For this reason, ANOVAs are useful in comparing (testing) three or more means (groups or variables) for statistical significance.
ANOVA is a particular form of statistical hypothesis testing heavily used in the analysis of experimental data. In the typical application of ANOVA, the null hypothesis is that all groups are simply random samples of the same population. This implies that all treatments have the same effect (perhaps none). Rejecting the null hypothesis implies that different treatments result in altered effects.
Characteristics of ANOVA
ANOVA is used in the analysis of comparative experiments—those in which only the difference in outcomes is of interest. The statistical significance of the experiment is determined by a ratio of two variances. This ratio is independent of several possible alterations to the experimental observations, so that adding a constant to all observations, or multiplying all observations by a constant, does not alter significance. Therefore, ANOVA statistical significance results are independent of constant bias and scaling errors as well as the units used in expressing observations.
The calculations of ANOVA can be characterized as computing a number of means and variances, dividing two variances and comparing the ratio to a handbook value to determine statistical significance. Calculating a treatment effect is then trivial; therefore, the effect of any treatment is estimated by taking the difference between the mean of the observations which receive the treatment and the general mean.
Summary
ANOVA is the synthesis of several ideas and it is used for multiple purposes. As a consequence, it is difficult to define concisely or precisely. In short, ANOVA is a statistical tool used in several ways to develop and confirm an explanation for the observed data. Additionally:
- It is computationally elegant and relatively robust against violations to its assumptions.
- ANOVA provides industrial strength (multiple sample comparison) statistical analysis.
- It has been adapted to the analysis of a variety of experimental designs.
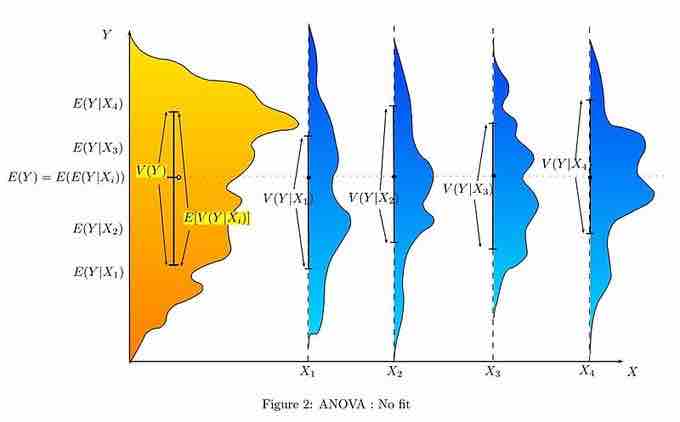
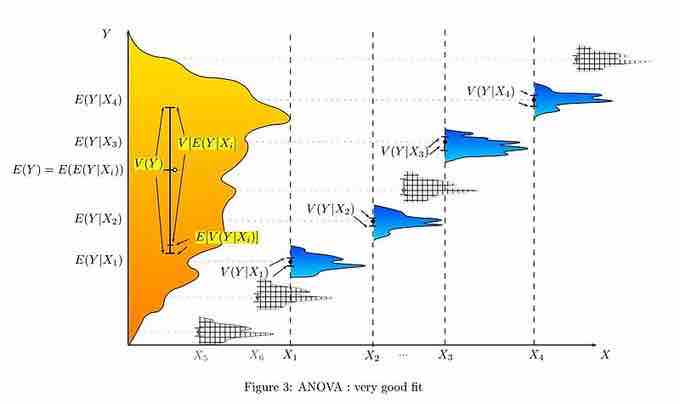
As a result, ANOVA has long enjoyed the status of being the most used (some would say abused) statistical technique in psychological research, and ANOVA is probably the most useful technique in the field of statistical inference. ANOVA with a very good fit and ANOVA with no fit are shown, respectively, in and .

ANOVA With No Fit
This graph shows a representation of a situation with no fit at all in terms of ANOVA statistics.

ANOVA With Very Good Fit
This graph is a representation of a situation with a very good fit in terms of ANOVA statistics