Deriving a Confidence Interval
For non-standard applications, there are several routes that might be taken to derive a rule for the construction of confidence intervals. Established rules for standard procedures might be justified or explained via several of these routes. Typically a rule for constructing confidence intervals is closely tied to a particular way of finding a point estimate of the quantity being considered.
- Descriptive statistics - This is closely related to the method of moments for estimation. A simple example arises where the quantity to be estimated is the mean, in which case a natural estimate is the sample mean. The usual arguments indicate that the sample variance can be used to estimate the variance of the sample mean. A naive confidence interval for the true mean can be constructed centered on the sample mean with a width which is a multiple of the square root of the sample variance.
- Likelihood theory - The theory here is for estimates constructed using the maximum likelihood principle. It provides for two ways of constructing confidence intervals (or confidence regions) for the estimates.
- Estimating equations - The estimation approach here can be considered as both a generalization of the method of moments and a generalization of the maximum likelihood approach. There are corresponding generalizations of the results of maximum likelihood theory that allow confidence intervals to be constructed based on estimates derived from estimating equations.
- Significance testing - If significance tests are available for general values of a parameter, then confidence intervals/regions can be constructed by including in the
$100p\%$ confidence region all those points for which the significance test of the null hypothesis that the true value is the given value is not rejected at a significance level of$1-p$ . - Bootstrapping - In situations where the distributional assumptions for the above methods are uncertain or violated, resampling methods allow construction of confidence intervals or prediction intervals. The observed data distribution and the internal correlations are used as the surrogate for the correlations in the wider population.
Meaning and Interpretation
For users of frequentist methods, various interpretations of a confidence interval can be given:
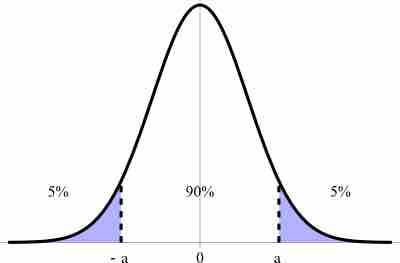
- The confidence interval can be expressed in terms of samples (or repeated samples): "Were this procedure to be repeated on multiple samples, the calculated confidence interval (which would differ for each sample) would encompass the true population parameter 90% of the time. " Note that this does not refer to repeated measurement of the same sample, but repeated sampling.
- The explanation of a confidence interval can amount to something like: "The confidence interval represents values for the population parameter, for which the difference between the parameter and the observed estimate is not statistically significant at the 10% level. " In fact, this relates to one particular way in which a confidence interval may be constructed.
- The probability associated with a confidence interval may also be considered from a pre-experiment point of view, in the same context in which arguments for the random allocation of treatments to study items are made. Here, the experimenter sets out the way in which they intend to calculate a confidence interval. Before performing the actual experiment, they know that the end calculation of that interval will have a certain chance of covering the true but unknown value. This is very similar to the "repeated sample" interpretation above, except that it avoids relying on considering hypothetical repeats of a sampling procedure that may not be repeatable in any meaningful sense.
In each of the above, the following applies: If the true value of the parameter lies outside the 90% confidence interval once it has been calculated, then an event has occurred which had a probability of 10% (or less) of happening by chance.

Confidence Interval
This figure illustrates a 90% confidence interval on a standard normal curve.