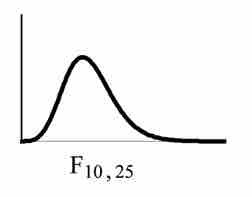
Most

$F$ -Distribution
The
There are two sets of degrees of freedom for the
To calculate the
- Variance between samples: An estimate of
$\sigma^2$ that is the variance of the sample means multiplied by$n$ (when there is equal$n$ ). If the samples are different sizes, the variance between samples is weighted to account for the different sample sizes. The variance is also called variation due to treatment or explained variation. - Variance within samples: An estimate of
$\sigma^2$ that is the average of the sample variances (also known as a pooled variance). When the sample sizes are different, the variance within samples is weighted. The variance is also called the variation due to error or unexplained variation.
-
$SS_{\text{between}}$ is the sum of squares that represents the variation among the different samples. -
$SS_{\text{within}}$ is the sum of squares that represents the variation within samples that is due to chance.
To find a "sum of squares" is to add together squared quantities which, in some cases, may be weighted.
Calculation of Sum of Squares and Mean Square
-
$k$ is the number of different groups -
$n_j$ is the size of the$j$ th group -
$s_j$ is the sum of the values in the$j$ th group -
$n$ is total number of all the values combined. (Total sample size:$\sum_j n_j$ ) -
$x$ is one value:$\sum x = \sum_j s_j$ - Sum of squares of all values from every group combined:
$\sum x^2$ - Between group variability:
$\displaystyle { SS }_{ \text{total} }=\sum { { x }^{ 2 }- } \frac { { \left( \sum { x } \right) }^{ 2 } }{ n }$ - Total sum of squares:
$\displaystyle \sum { { x }^{ 2 }- } \frac { { \left( \sum { x } \right) }^{ 2 } }{ n }$ - Explained variation: sum of squares representing variation among the different samples
$\displaystyle { SS }_{ \text{between} }=\sum { \left[ \frac { { \left( s_j \right) }^{ 2 } }{ { n }_{ j } } \right] - } \frac { { \left( \sum { { s }_{ j } } \right) }^{ 2 } }{ n }$ - Unexplained variation: sum of squares representing variation within samples due to chance:
$SS_{\text{within}} = SS_{\text{total}} = SS_{\text{between}}$ -
$df$ 's for different groups ($df$ 's for the numerator):$df_{\text{between}} = k-1$ - Equation for errors within samples (
$df$ 's for the denominator):$df_{\text{within}} = n-k$ - Mean square (variance estimate) explained by the different groups:
$\displaystyle { MS }_{ \text{between} }=\frac { { SS }_{ \text{between} } }{ { df }_{ \text{between} } }$ - Mean square (variance estimate) that is due to chance (unexplained):
$\displaystyle{ MS }_{ \text{within} }=\frac { { SS }_{ \text{within} } }{ { df }_{ \text{within} } }$
MSbetween and MSwithin can be written as follows:
-
$\displaystyle { MS }_{ \text{between} }=\frac { { SS }_{ \text{between} } }{ { df }_{ \text{between} } } =\frac { { SS }_{ \text{between} } }{ k-1 }$ -
$\displaystyle { MS }_{ \text{within} }=\frac { { SS }_{ \text{within} } }{ { df }_{ \text{within} } } =\frac { { SS }_{ \text{within} } }{ n-k }$
The one-way ANOVA test depends on the fact that
The null hypothesis says that all groups are samples from populations having the same normal distribution. The alternate hypothesis says that at least two of the sample groups come from populations with different normal distributions. If the null hypothesis is true,
F Ratio
If