It is often desirable to compare two variances, rather than two means or two proportions. For instance, college administrators would like two college professors grading exams to have the same variation in their grading. In order for a lid to fit a container, the variation in the lid and the container should be the same. A supermarket might be interested in the variability of check-out times for two checkers. In order to compare two variances, we must use the
In order to perform a
- The populations from which the two samples are drawn are normally distributed.
- The two populations are independent of each other.
Suppose we sample randomly from two independent normal populations. Let
If the null hypothesis is
Note that the
If the two populations have equal variances, then
Therefore, if
A test of two variances may be left, right, or two-tailed.
Example
Two college instructors are interested in whether or not there is any variation in the way they grade math exams. They each grade the same set of 30 exams. The first instructor's grades have a variance of 52.3. The second instructor's grades have a variance of 89.9.
Test the claim that the first instructor's variance is smaller. (In most colleges, it is desirable for the variances of exam grades to be nearly the same among instructors.) The level of significance is 10%.
Solution
Let 1 and 2 be the subscripts that indicate the first and second instructor, respectively:
Calculate the test statistic: By the null hypothesis (
Distribution for the test:
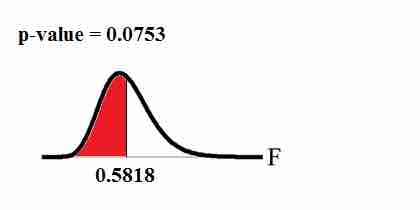
Graph: This test is left-tailed:

$p$ -Value Graph
This image shows the graph of the
Probability statement:
Compare
Make a decision: Since
Conclusion: With a 10% level of significance, from the data, there is sufficient evidence to conclude that the variance in grades for the first instructor is smaller.