Suppose you are trying to determine the average rent of a two-bedroom apartment in your town. You might look in the classified section of the newpaper, write down several rents listed, and then average them together—from this you would obtain a point estimate of the true mean. If you are trying to determine the percent of times you make a basket when shooting a basketball, you might count the number of shots you make, and divide that by the number of shots you attempted. In this case, you would obtain a point estimate for the true proportion.
In inferential statistics, we use sample data to make generalizations about an unknown population. The sample data help help us to make an estimate of a population parameter. We realize that the point estimate is most likely not the exact value of the population parameter, but close to it. After calculating point estimates, we construct confidence intervals in which we believe the parameter lies.
A confidence interval is a type of estimate (like a sample average or sample standard deviation), in the form of an interval of numbers, rather than only one number. It is an observed interval (i.e., it is calculated from the observations), used to indicate the reliability of an estimate. The interval of numbers is an estimated range of values calculated from a given set of sample data. How frequently the observed interval contains the parameter is determined by the confidence level or confidence coefficient. Note that the confidence interval is likely to include an unknown population parameter.
Philosophical Issues
The principle behind confidence intervals provides an answer to the question raised in statistical inference: how do we resolve the uncertainty inherent in results derived from data that (in and of itself) is only a randomly selected subset of a population? Bayesian inference provides further answers in the form of credible intervals.
Confidence intervals correspond to a chosen rule for determining the confidence bounds; this rule is essentially determined before any data are obtained or before an experiment is done. The rule is defined such that over all possible datasets that might be obtained, there is a high probability ("high" is specifically quantified) that the interval determined by the rule will include the true value of the quantity under consideration—a fairly straightforward and reasonable way of specifying a rule for determining uncertainty intervals.
Ostensibly, the Bayesian approach offers intervals that (subject to acceptance of an interpretation of "probability" as Bayesian probability) offer the interpretation that the specific interval calculated from a given dataset has a certain probability of including the true value (conditional on the data and other information available). The confidence interval approach does not allow this, as in this formulation (and at this same stage) both the bounds of the interval and the true values are fixed values; no randomness is involved.

Confidence Interval
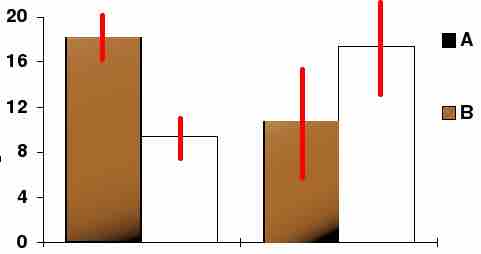
In this bar chart, the top ends of the bars indicate observation means and the red line segments represent the confidence intervals surrounding them. Although the bars are shown as symmetric in this chart, they do not have to be symmetric.