Chapter 2
Introduction to Equations, Inequalities, and Graphing
By Boundless
Variables are useful in mathematics for many reasons, and can be used to denote different types of arbitrary or unknown numbers.
Simplifying algebraic expressions may require one to follow some key steps to add and subtract like terms.

The process for multiplying algebraic expressions differs for monomials and polynomials.
Radical expressions containing variables can be simplified to a basic expression in a similar way to those involving only integers.
The rules for operating on numbers with exponents can be applied to variables with exponents as well.
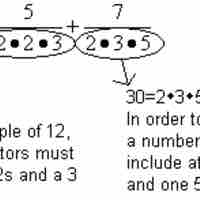
The addition and subtraction of rational expressions are bound by all of the same rules as the addition and subtraction of fractions.
Equations with variables have solutions, or values for the variables that make the statements true.
The addition and multiplication properties of equalities are common ways used to solve equations.

A rational equation sets two rational expressions equal to each other and involves unknown values that make the equation true.
Equations involving radicals are often solved by moving the radical to one side of the equation and then squaring both sides.

To solve an equation with an absolute value, first isolate the absolute value, and then solve for the positive and negative cases.
Inequalities are used to demonstrate relationships between numbers or expressions.
Operations can be conducted on inequalities and used to solve inequalities for all possible values of a variable.

A compound inequality involves three expressions, not two, but can also be solved to find the possible values for a variable.

Inequalities with absolute values can be solved by thinking about absolute value as a number's distance from 0 on the number line.
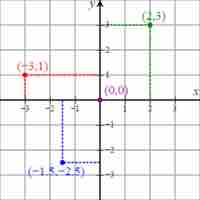
The Cartesian coordinate system is used to visualize points on a graph by showing the points' distances from two axes.
Equations in two variables represent the relationship between two variables and have a series of solutions.
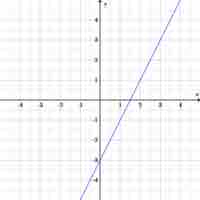
Equations and their relationships can be visualized in many different types of graphs.
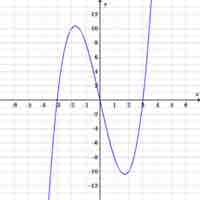
A solution to an equation can be plotted on graphs to better visualize how the equation, or function, behaves.
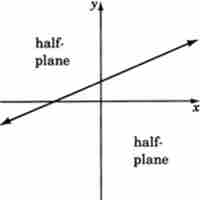
The solutions to inequalities can be graphed by drawing a boundary line to divide the coordinate plane in two and shading in one of those parts.