5 concepts
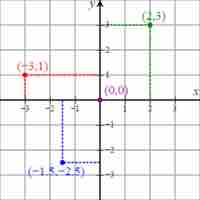
The Cartesian System
The Cartesian coordinate system is used to visualize points on a graph by showing the points' distances from two axes.
Equations in Two Variables
Equations in two variables represent the relationship between two variables and have a series of solutions.
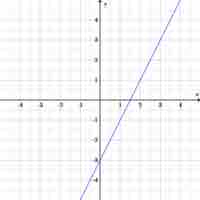
Graphing Equations
Equations and their relationships can be visualized in many different types of graphs.
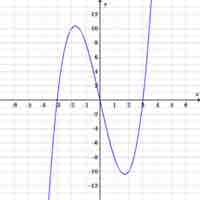
Graphs of Equations as Graphs of Solutions
A solution to an equation can be plotted on graphs to better visualize how the equation, or function, behaves.
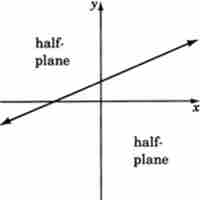
Graphing Inequalities
The solutions to inequalities can be graphed by drawing a boundary line to divide the coordinate plane in two and shading in one of those parts.