The SML Approach
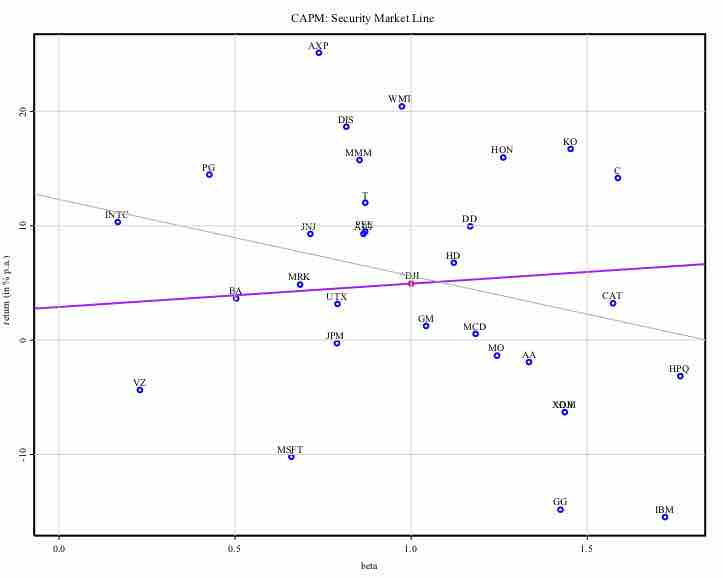
The Security Market Line (SML) is the graphical representation of the capital asset pricing model (CAPM), with the x-axis representing the risk (beta), and the y-axis representing the expected return. It graphs the relationship between beta (β) and expected return, i.e. it shows expected return as a function of β. The y-intercept of the SML is equal to the risk-free interest rate, while the slope is equal to the market risk premium (the market's rate of return minus the risk-free rate). The slope also represents the risk-return tradeoff at a given time. The SML is applicable to any asset.

SML Equation
The SML is the graphical representation of CAPM, and thus is found using the same equation.
Applications of the SML
Individual assets that are correctly priced are plotted on the SML. In the ideal world of CAPM, all assets are correctly priced and thus lie on the SML. In real market scenarios, we are able to use the SML graph to determine if an asset being considered for a portfolio offers a reasonable expected return for the risk. If an asset is priced at a point above the SML, it is undervalued, since for a given amount of risk, it yields a higher return. Conversely, an asset priced below the SML is overvalued, since for a given amount of risk, it yields a lower return.

CAPM-SML
The Security Market Line for the Dow Jones Industrial Average over a 3 year period, with the x-axis representing beta and the y-axis representing expected return.
Another way to think about real market applications of the SML would be in terms of buying and selling securities. If an asset is priced above the SML, and thus undervalued, it should be bought. If an asset is priced below the SML, and thus overvalued, it should be sold.