When considering assets for the diversification of an investment portfolio, investors and financiers use a variety of tools to project the required rate of return and risk of a given investment. All this really means is that investors are on the look out for ways to minimize risk, maximize returns, and invest intelligently in assets that are well-priced. The key assumption here is that the market will self-correct to adjust each investment option's expected return to the relative risk of investing.
The Capital Asset Pricing Model
When measuring the ratio between risk and return on a given investment, the capital asset pricing model (CAPM) can be a useful tool. This model focuses on measuring a given asset's sensitivity to systematic risk (also referred to as market risk) in relation to the expected return compared to that of a theoretical risk-free asset.
How CAPM Works
This sounds complicated, but it's simpler than it seems. All this really means is that the CAPM tries to measure the risk the market will offer the asset compared to the risk-free rate, and make sure the expected return will offset that risk. To understand this concept, there are a few variables that are useful to identify up front:
- E(Ri) is an expected return on security
- E(RM) is an expected return on market portfolio M
- β is a non-diversifiable or systematic risk
- RM is a market rate of return
- Rf is a risk-free rate
There are quite a few ways to rearrange the relationship between these variables to derive meaningful information. Like all equations, depending on what you know you can solve for what you don't know as well. For a basic CAPM calculations, you would want to solve for the expected return on a security, which looks like this:
Security Market Line
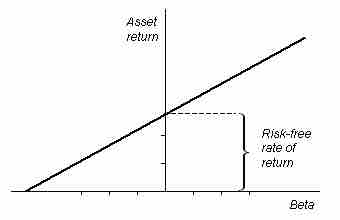
Through rearranging these variables, you can also take a look at the concept of the security market line (SML), which underlines a security's relationship with systematic risk and respected return in a graphical format. This is written as:

Security Market Line
The security market line is illustrated in this graph, where an assets expected return can be visualized.
Risk and Return
A final application of the CAPM variables in relation to one another is in deriving a ratio that illustrates the relationship between risk and return. On the left side of the equation below, you have an assessment of the overall risk relative to a risk-free asset. On the right side, you have the overall return (similarly relative to a risk-free asset). This can be written as follows:
Investors can utilize the CAPM equation and its various implications to assess a variety of market investment opportunities to diversify a portfolio and identify undervalued assets.