
File:Greenhouse Effect.svg
| |
This is a file from the Wikimedia Commons. Information from its description page there is shown below.
Commons is a freely licensed media file repository. You can help. |
Contents |
Summary
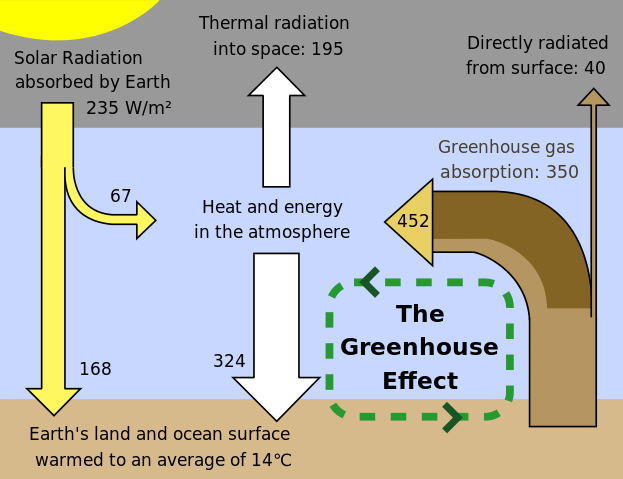
This figure is a simplified, schematic representation of the flows of energy between space, the atmosphere, and the Earth's surface, and shows how these flows combine to trap heat near the surface and create the greenhouse effect. Energy exchanges are expressed in watts per square meter (W/m2) and derived from Kiehl & Trenberth (1997).
The sun is responsible for virtually all energy that reaches the Earth's surface. Direct overhead sunlight at the top of the atmosphere provides 1366 W/m2; however, geometric effects and reflective surfaces limit the light which is absorbed at the typical location to an annual average of ~235 W/m2. If this were the total heat received at the surface, then, neglecting changes in albedo, the Earth's surface would be expected to have an average temperature of -18 °C (Lashof 1989). Instead, the Earth's atmosphere recycles heat coming from the surface and delivers an additional 324 W/m2, which results in an average surface temperature of roughly +14 °C .
Of the surface heat captured by the atmosphere, more than 75% can be attributed to the action of greenhouse gases that absorb thermal radiation emitted by the Earth's surface. The atmosphere in turn transfers the energy it receives both into space (38%) and back to the Earth's surface (62%), where the amount transferred in each direction depends on the thermal and density structure of the atmosphere This process by which energy is recycled in the atmosphere to warm the Earth's surface is known as the greenhouse effect and is an essential piece of Earth's climate. Under stable conditions, the total amount of energy entering the system from solar radiation will exactly balance the amount being radiated into space, thus allowing the Earth to maintain a constant average temperature over time. However, recent measurements indicate that the Earth is presently absorbing 0.85 ± 0.15 W/m2 more than it emits into space (Hansen et al. 2005). An overwhelming majority of climate scientists believe that this asymmetry in the flow of energy has been significantly increased by human emissions of greenhouse gases .
Licensing
 |
Permission is granted to copy, distribute and/or modify this document under the terms of the GNU Free Documentation License, Version 1.2 only as published by the Free Software Foundation; with no Invariant Sections, no Front-Cover Texts, and no Back-Cover Texts. A copy of the license is included in the section entitled GNU Free Documentation License. | 1.2 only |
This figure was created by Robert A. Rohde from published data and is part of the Global Warming Art project.
Original image: http://www.globalwarmingart.com/wiki/Image:Greenhouse_Effect_png
It was converted to SVG by User:Rugby471.
References
- Kiehl, J. T. and Trenberth, K. E. (1997). " Earth's Annual Global Mean Energy Budget". Bulletin of the American Meteorological Association 78: 197-208.
- Daniel A. Lashof (1989). "The dynamic greenhouse: Feedback processes that may influence future concentrations of atmospheric trace gases and climatic change". Climatic Change 14 (3): 213-242.
- James Hansen, Larissa Nazarenko, Reto Ruedy, Makiko Sato, Josh Willis, Anthony Del Genio, Dorothy Koch, Andrew Lacis, Ken Lo, Surabi Menon, Tica Novakov, Judith Perlwitz, Gary Russell, Gavin A. Schmidt, Nicholas Tausnev (2005). "Earth's Energy Imbalance: Confirmation and Implications". Science 308 (5727): 1431-1435.
derivative works
Derivative works of this file:
File usage
Metadata
A background to Schools Wikipedia
Through Schools Wikipedia, SOS Childrens Villages has brought learning to children around the world. SOS Childrens Villages cares for children who have lost their parents. Our Children's Villages give these children a new home and a new family, while a high-quality education and the best of medical care ensures they will grow up with all they need to succeed in adult life. Help another child by taking out a sponsorship