What is a Relative Frequency Distribution?
A relative frequency is the fraction or proportion of times a value occurs. To find the relative frequencies, divide each frequency by the total number of data points in the sample. Relative frequencies can be written as fractions, percents, or decimals.
How to Construct a Relative Frequency Distribution
Constructing a relative frequency distribution is not that much different than from constructing a regular frequency distribution. The beginning process is the same, and the same guidelines must be used when creating classes for the data. Recall the following:
- Each data value should fit into one class only (classes are mutually exclusive).
- The classes should be of equal size.
- Classes should not be open-ended.
- Try to use between 5 and 20 classes.
Create the frequency distribution table, as you would normally. However, this time, you will need to add a third column. The first column should be labeled Class or Category. The second column should be labeled Frequency. The third column should be labeled Relative Frequency. Fill in your class limits in column one. Then, count the number of data points that fall in each class and write that number in column two.
Next, start to fill in the third column. The entries will be calculated by dividing the frequency of that class by the total number of data points. For example, suppose we have a frequency of 5 in one class, and there are a total of 50 data points. The relative frequency for that class would be calculated by the following:
You can choose to write the relative frequency as a decimal (0.10), as a fraction (
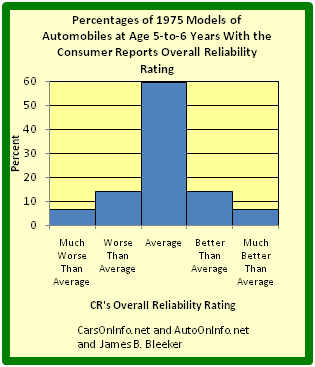
Relative frequency distributions is often displayed in histograms and in frequency polygons. The only difference between a relative frequency distribution graph and a frequency distribution graph is that the vertical axis uses proportional or relative frequency rather than simple frequency.

Relative Frequency Histogram
This graph shows a relative frequency histogram. Notice the vertical axis is labeled with percentages rather than simple frequencies.
Cumulative Relative Frequency Distributions
Just like we use cumulative frequency distributions when discussing simple frequency distributions, we often use cumulative frequency distributions when dealing with relative frequency as well. Cumulative relative frequency (also called an ogive) is the accumulation of the previous relative frequencies. To find the cumulative relative frequencies, add all the previous relative frequencies to the relative frequency for the current row.