Concept
Version 11
Created by Boundless
Relative Frequency Distributions

Relative Frequency Histogram
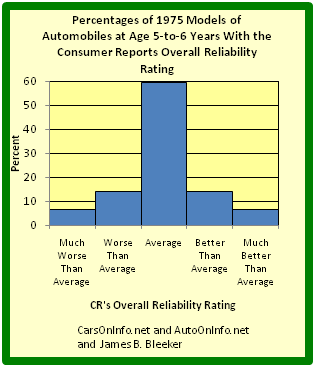
This graph shows a relative frequency histogram. Notice the vertical axis is labeled with percentages rather than simple frequencies.
Source
Boundless vets and curates high-quality, openly licensed content from around the Internet. This particular resource used the following sources:
"Histogram of Consumer Reports."
http://commons.wikimedia.org/wiki/File:Histogram_of_Consumer_Reports
Wikimedia
CC BY-SA.