Concept
Version 16
Created by Boundless
Basic Descriptive Statistics

Boxplot
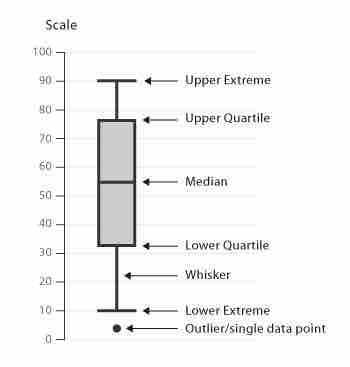
A boxplot has marks to indicate the upper and lower extreme, as well as the upper and lower quartile and median of the data.
Source
Boundless vets and curates high-quality, openly licensed content from around the Internet. This particular resource used the following sources:
"box_plot.png."
http://www.datavizcatalogue.com/methods/box_plot.html#.Vb5XazBViko
Data Viz Catalogue
CC BY-SA 3.0.