Potential for Inaccuracy
In practice, pollsters need to balance the cost of a large sample with the reduction in sampling error. A sample size of around 500 – 1,000 is a typical compromise for political polls . Another way to reduce the margin of error is to rely on poll averages. This method is based on the assumption that the procedure and sample size is similar enough between many different polls to justify creating a polling average.

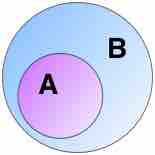
Venn Diagram: A Subset B
This Venn diagram illustrates the sample population within the larger, general population.
Another source of error stems from faulty demographic models by pollsters who weigh their samples by particular variables such as party identification in an election. For example, one could assume that the breakdown of the US population by party identification has not changed since the previous presidential election. As a result, one would underestimate a victory or a defeat of a particular party candidate that saw a surge or decline in its party registration relative to the previous presidential election cycle.
Theories on Erroneous Polling Results
A number of theories and mechanisms have been offered to explain erroneous polling results. Some of these reflect errors on the part of the pollsters; many of them are statistical in nature. Others blame the respondents for not giving candid answers (the controversial Bradley effect & Shy Tory Factor).
Non-response Bias
Since some people do not answer calls from strangers or refuse to answer the poll, poll samples may not be representative samples from a population due to a non-response bias. Because of this selection bias, the characteristics of those who agree to be interviewed may be markedly different from those who decline. That is, the actual sample is a biased version of the universe the pollster wants to analyze. In these cases, bias introduces new errors, in addition to errors caused by sample size. Error due to bias does not become smaller with larger sample sizes--taking a larger sample size simply repeats the same mistake on a larger scale.
Response Bias
Surveys may be affected by response bias, where the answers given by respondents do not reflect their true beliefs. This may be deliberately engineered by unscrupulous pollsters in order to generate a certain result or please their clients, but more often is a result of the detailed wording or ordering of questions. Respondents may deliberately try to manipulate the outcome of a poll by advocating a more extreme position than they actually hold in order to boost their side of the argument or give rapid and ill-considered answers in order to hasten the end of their questioning. Respondents may also feel under social pressure not to give an unpopular answer. In American political parlance, this phenomenon is often referred to as the Bradley effect. If the results of surveys are widely publicized this effect may be magnified in a phenomenon commonly referred to as the spiral of silence.
Wording of Questions
It is well established that the wording of the questions, the order in which they are asked, and the number and form of alternative answers offered can influence results of polls. For instance, the public is more likely to indicate support for a person who is described by the operator as one of the "leading candidates. "
A common technique to control for this bias is to rotate the order in which questions are asked. Many pollsters also split-sample in that one of two different versions of a question are presented to half the respondents.
Coverage Bias
Another source of error is the use of samples that are not representative of the population as a consequence of the polling methodology. For example, telephone sampling has a built-in error because in many times and places, those with telephones have generally been richer than those without.
Selection Bias
Selection bias occurs when some units have a differing probability of selection that is unaccounted for by the researcher. For example, some households have multiple phone numbers making them more likely to be selected in a telephone survey than households with only one phone number.
In statistics, self-selection bias arises in any situation in which individuals select themselves into a group, causing a biased sample with non-probability sampling. It is commonly used to describe situations where the characteristics of the people which cause them to select themselves in the group create abnormal or undesirable conditions in the group.
There may be a purposeful intent on the part of respondents leading to self-selection bias whereas other types of selection bias may arise more inadvertently, possibly as the result of mistakes by those designing any given study.