Danish Physicist Neils Bohr was clever enough to discover a method of calculating the electron orbital energies in hydrogen. As we've seen in the previous module "The Bohr Model of Atom," Bohr assumed that the electrons can only orbit stably, without radiating, in certain orbits (named by Bohr as "stationary orbits"), at a certain discrete set of distances from the nucleus. These "Bohr orbits" have a very important feature of quantization as shown in the following. This was an important first step that has been improved upon, but it is well worth repeating here, as it correctly describes many characteristics of hydrogen. Assuming circular orbits, Bohr proposed that the angular momentum
where
Quantization says that this value of
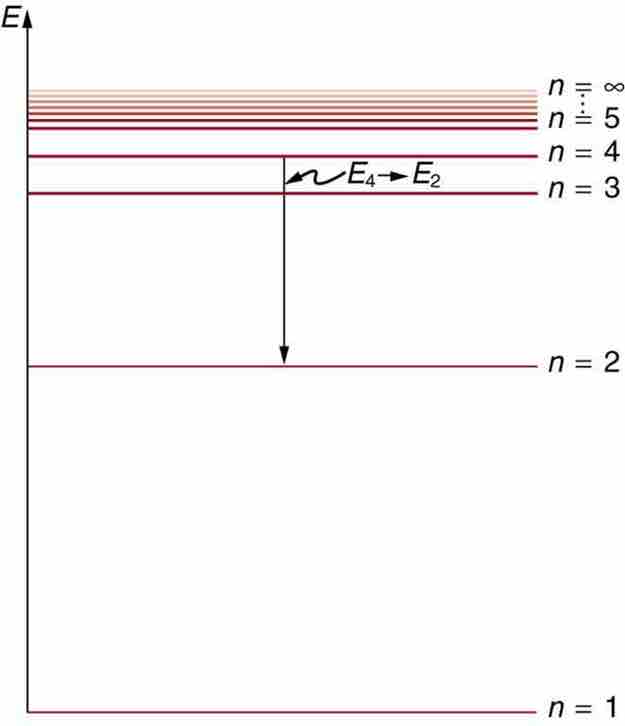
Below is an energy-level diagram, which is a convenient way to display energy states—the allowed energy levels of the electron (as relative to our discussion). Energy is plotted vertically with the lowest or ground state at the bottom and with excited states above. Given the energies of the lines in an atomic spectrum, it is possible (although sometimes very difficult) to determine the energy levels of an atom. Energy-level diagrams are used for many systems, including molecules and nuclei. A theory of the atom or any other system must predict its energies based on the physics of the system.

Energy-Level Diagram Plot
An energy-level diagram plots energy vertically and is useful in visualizing the energy states of a system and the transitions between them. This diagram is for the hydrogen-atom electrons, showing a transition between two orbits having energies