Concept
Version 9
Created by Boundless
Bohr Orbits

Energy-Level Diagram Plot
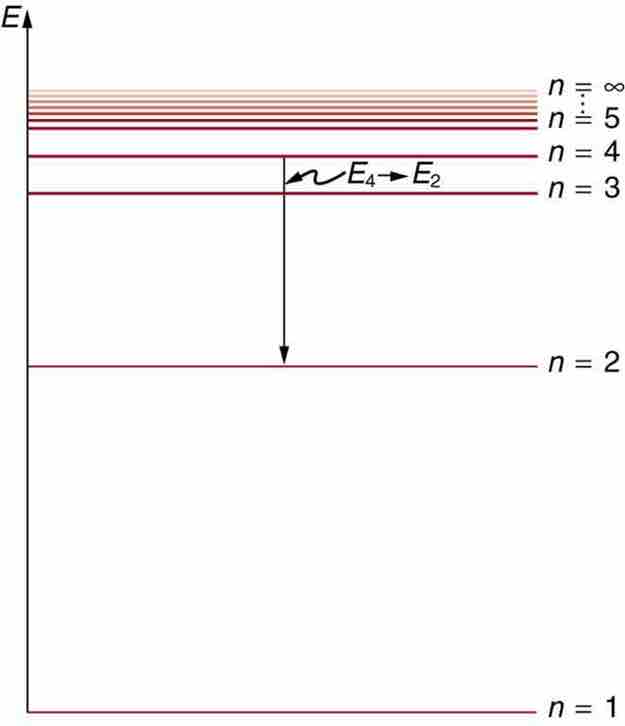
An energy-level diagram plots energy vertically and is useful in visualizing the energy states of a system and the transitions between them. This diagram is for the hydrogen-atom electrons, showing a transition between two orbits having energies
Source
Boundless vets and curates high-quality, openly licensed content from around the Internet. This particular resource used the following sources:
"OpenStax College, Bohr’s Theory of the Hydrogen Atom. January 28, 2013."
http://cnx.org/content/m42596/latest/
OpenStax CNX
CC BY 3.0.