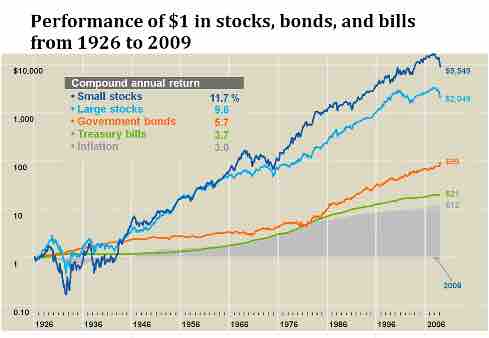
Performance of Stocks, Bonds and Bills
This graph gives an illustration of investing a dollar in different asset classes in the market from 1926 to the end of 2007.
Source
Boundless vets and curates high-quality, openly licensed content from around the Internet. This particular resource used the following sources:
"Performance of stocks, bonds and bills."
http://commons.wikimedia.org/wiki/File:Performance_of_stocks,_bonds_and_bills.png
Wikimedia
CC BY-SA.