Concept
Version 7
Created by Boundless
Shifts in the Money Demand Curve

Shift of the Demand Curve
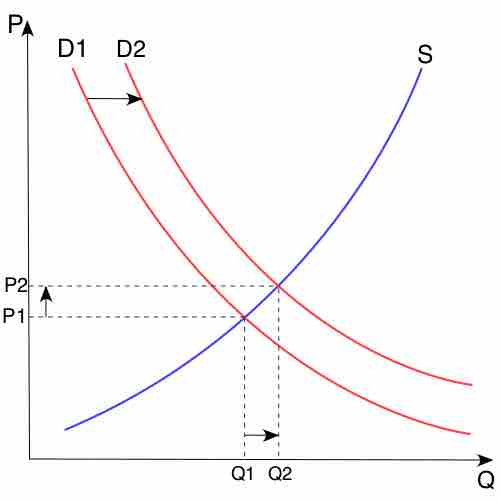
The graph shows both the supply and demand curve, with quantity of money on the x-axis (Q) and the price of money as interest rates on the y-axis (P). When the quantity of money demanded increase, the price of money (interest rates) also increases, and causes the demand curve to increase and shift to the right. A decrease in demand would shift the curve to the left.
Source
Boundless vets and curates high-quality, openly licensed content from around the Internet. This particular resource used the following sources: