Graphical Behavior of Functions
As part of exploring how functions change, we can identify intervals over which the function is changing in specific ways. We say that a function is increasing on an interval if the function values increase as the input values increase within that interval. Similarly, a function is decreasing on an interval if the function values decrease as the input values increase over that interval.
- An increasing function is one where for every
$x_1$ and$x_2$ that satisfies$x_2 > x_1$ , then$f(x_{2}) \geq f(x_{1})$ . If it is strictly greater than$(f(x_2)>f(x_1))$ , then it is strictly increasing. - A decreasing function is one where for every
$x_1$ and$x_2$ that satisfies$x_2 > x_1$ , then$f(x_{2}) \leq f(x_{1})$ . If it is strictly less than$(f(x_2) < f(x_1))$ , then it is strictly decreasing.
In terms of a linear function
The average rate of change of an increasing function is positive, and the average rate of change of a decreasing function is negative. The figure below shows examples of increasing and decreasing intervals on a function.
Types of Functions
The function
Constant Functions
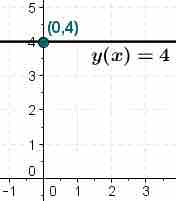
In mathematics, a constant function is a function whose values do not vary, regardless of the input into the function. A function is a constant function if

Constant Function
The graph of
Identifying Function Behavior
Example 1: Identify the intervals where the function is increasing, decreasing, or constant.
Look at the graph from left to right on the
Increasing Decreasing Function Graph
For the function pictured above, the curve is decreasing across the intervals: