Checked content

File:Exp series.gif

Exp_series.gif(292 × 392 pixels, file size: 51 KB, MIME type: image/gif, looped, 9 frames, 9.0 s)
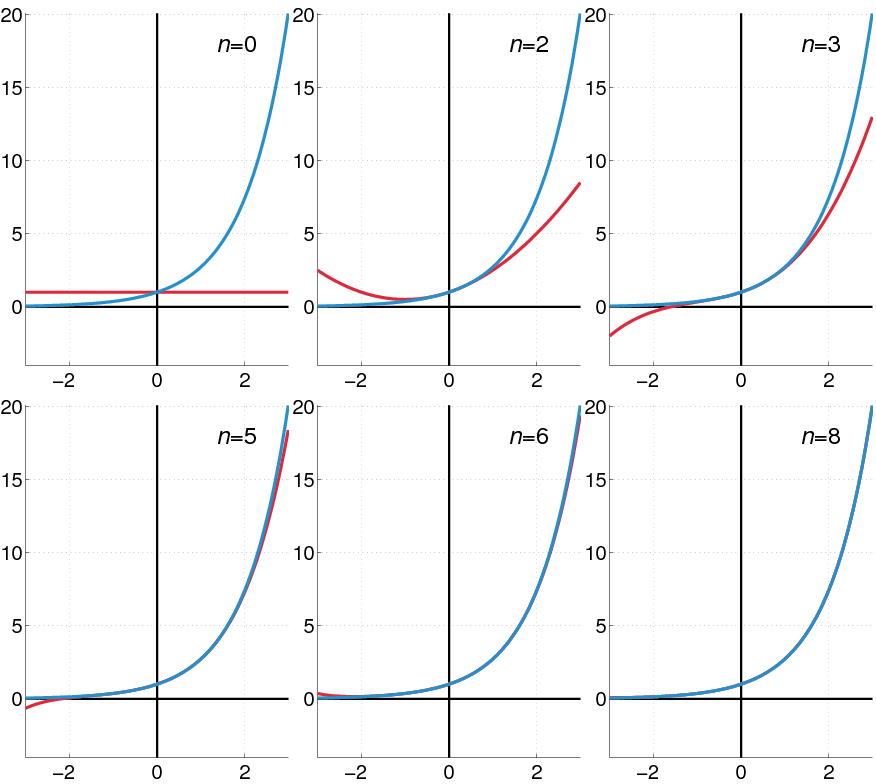
Description Illustration of the en:Exponential function
Date Oleg Alexandrov 03:11, 30 August 2007 (UTC)
Source self-made with MATLAB.
Author Oleg Alexandrov
Matlab Logo.png
This chart was created with MATLAB.
Public domain I, the copyright holder of this work, release this work into the public domain. This applies worldwide.
In some countries this may not be legally possible; if so:
I grant anyone the right to use this work for any purpose, without any conditions, unless such conditions are required by law.

MATLAB source code

% The exponential function as the sum of its Taylor series
 
function main()
 
   % KSmrq's colors
   red    = [0.867 0.06 0.14];
   blue   = [0, 129, 205]/256;
   green  = [0, 200,  70]/256;
   yellow = [254, 194,   0]/256;
   white = 0.99*[1, 1, 3];
 
% Set up the grid and other parameters
   N = 100;
   A = -3; B = 3; 
   X = linspace(A, B, N);
   Y = exp(X);
   D = max(Y); C = -0.2*D;
 
 
% plot the frames
 
   Sum = 0*X; Term = 0*X+1;
   num_frames = 8;
   for j=0:num_frames
 
      Sum = Sum+Term;
      Term = Term.*X/(j+1);
 
      % Set up the figure
      lw = 3; % linewidth
      fs = 20; % font size
      figure(1); clf; set(gca, 'fontsize', fs);
      hold on; grid on;
      set(gca, 'DataAspectRatio', [1 3 1]); % aspect ratio
 
      plot_axes (A, B, C, D, lw/1.3);
 
      plot(X, Sum, 'colour', blue, 'linewidth', lw);
      plot(X, Y,   'colour', red, 'linewidth', lw);
 
      axis([A, B, C, D]);
 
      text_str = sprintf('{\\it n}=%d', j)
      H= text (1.2, 18, text_str, 'fontsize', floor(1.2*fs))
 
      frame=sprintf('Frame%d.eps', 1000+j);
      disp(frame)
      saveas(gcf, frame, 'psc2');
 
   end
 
% Convert to animation with the command
% convert -antialias -loop 10000  -delay 100 -compress LZW Frame100* Exp_series.gif
 
 
function plot_axes (A, B, C, D, lw)
 
   black = [0, 0, 0];
 
   plot([A B], [0, 0], 'linewidth', lw, 'colour', black);
   plot([0, 0], [C, D], 'linewidth', lw, 'colour', black);
The following pages on Schools Wikipedia link to this image (list may be incomplete):

Find out about Schools Wikipedia

Schools Wikipedia was launched to make learning available to everyone. SOS Childrens Villages cares for children who have lost their parents. Our Children's Villages give these children a new home and a new family, while a high-quality education and the best of medical care ensures they will grow up with all they need to succeed in adult life. Have you thought about sponsoring a child?