 |
This is a file from the Wikimedia Commons. Information from its description page there is shown below.
Commons is a freely licensed media file repository. You can help.
|
 |
This graph image could be recreated using vector graphics as an SVG file. This has several advantages; see Commons:Media for cleanup for more information. If an SVG form of this image is already available, please upload it. After uploading an SVG, replace this template with {{ vector version available|new image name.svg}}. |
Summary
| DescriptionGDP per capita LA-Chile.png |
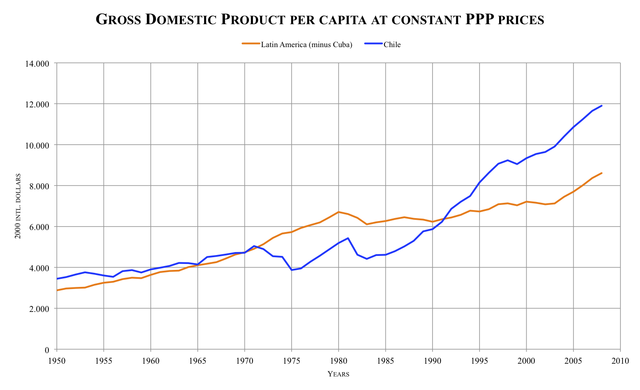
English: Gross domestic product per capita at constant PPP prices, 1950-2008. Latin America (minus Cuba) in orange, and Chile in blue (2000 international dollars). Sources: ECLAC( 1.1.1.1 Producto interno bruto, A.1 Población total and A.5 Tipos de cambio); IMF's April 2012 WEO database ( Implied PPP conversion rate for 2000). Latin America data includes: Argentina, Bolivia, Brazil, Chile, Colombia, Costa Rica, Dominican Republic, Ecuador, El Salvador, Guatemala, Haiti, Honduras, México, Nicaragua, Panama, Paraguay, Peru, Uruguay and Venezuela. Does not include Cuba due to missing data. Note: GDP in constant 2000 US dollars was multiplied by the 2000 exchange rate to the US dollar and divided by the 2000 implied PPP conversion rate. The result was divided by the population of the respective year.
|
| Date |
22 February 2010 |
| Source |
Own work |
| Author |
Cantus |
Licensing
| Public domainPublic domainfalsefalse |
 |
I, the copyright holder of this work, release this work into the public domain. This applies worldwide.
In some countries this may not be legally possible; if so:
I grant anyone the right to use this work for any purpose, without any conditions, unless such conditions are required by law.Public domainPublic domainfalsefalse
|
File usage
The following pages on Schools Wikipedia link to this image (list may be incomplete):
This file contains additional information, probably added from the digital camera or scanner used to create or digitize it. If the file has been modified from its original state, some details may not fully reflect the modified file.
Through Schools Wikipedia, SOS Children has brought learning to children around the world. SOS Childrens Villages works in 133 countries and territories across the globe, helps more than 62,000 children, and reaches over 2 million people in total. There are many ways to help with SOS Children.


