
File:Piecewise constant.svg
| |
This is a file from the Wikimedia Commons. Information from its description page there is shown below.
Commons is a freely licensed media file repository. You can help. |
Summary
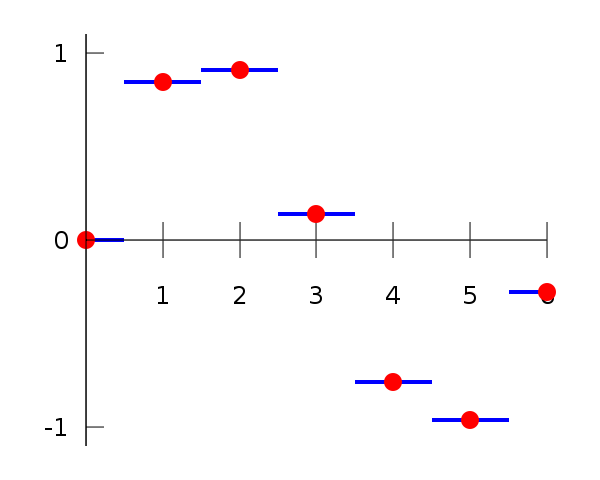
| Description | Illustration of constant interpolation, more precisely en:Nearest neighbour interpolation on the same dataset as listed in Interpolation. |
| Date | 23 June 2007 |
| Source | self-made in Gnuplot |
| Author | Berland |
Gnuplot source code
set terminal svg fname "Vera" fsize 25
set output "Piecewise_constant.svg"
set key off
set xzeroaxis
set xtics axis 1,1
set ytics nomirror 1
set border 2
set yrange [-1.1:1.1]
plot "-" with lines linetype 3 linewidth 4, \
     "-" with lines linetype 3 linewidth 4, \
     "-" with lines linetype 3 linewidth 4, \
     "-" with lines linetype 3 linewidth 4, \
     "-" with lines linetype 3 linewidth 4, \
     "-" with lines linetype 3 linewidth 4, \
     "-" with lines linetype 3 linewidth 4, \
     "-" with points linetype 1 pointtype 7 pointsize 1, \
     0 with lines -1
0 0
0.5 0
e
0.5 0.8415
1.5 0.8415
e
1.5 0.9093
2.5 0.9093
e
2.5 0.1411
3.5 0.1411
e
3.5 -0.7568
4.5 -0.7568
e
4.5 -0.9589
5.5 -0.9589
e
5.5 -0.2794
6.0 -0.2794
e
0 0
1 0.8415
2 0.9093
3 0.1411
4 -0.7568
5 -0.9589
6 -0.2794
e
Licensing
 |
This work has been released into the public domain by its author, I, Berland. This applies worldwide. In some countries this may not be legally possible; if so: I, Berland grants anyone the right to use this work for any purpose, without any conditions, unless such conditions are required by law.
|
This version replaces the version of User:Cronholm144, this version has some style changes, and don't have dashed vertical lines.
File usage
The following pages on Schools Wikipedia link to this image (list may be incomplete):
Metadata
Learn more
Schools Wikipedia was launched to make learning available to everyone. SOS Children helps those who have nothing and no one, giving them back the famly they have lost and bringing them the very best opportunities for a happy, healthy future. Find out how you can help children in other countries.