
File:Carbon Dioxide 400kyr.png
| |
This is a file from the Wikimedia Commons. Information from its description page there is shown below.
Commons is a freely licensed media file repository. You can help. |
Summary
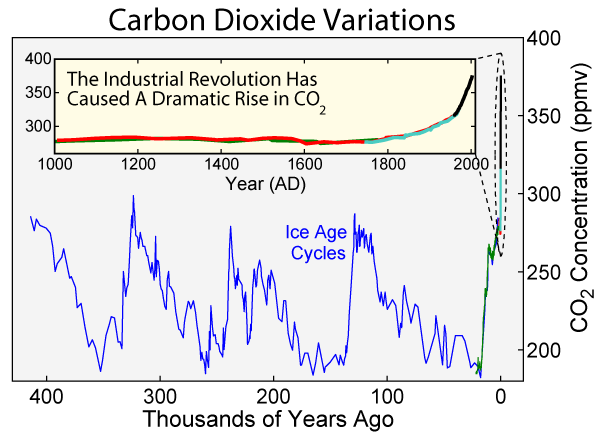
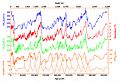
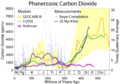
This figure shows the variations in concentration of carbon dioxide (CO2) in the atmosphere during the last 300 thousand years. Throughout most of the record, the largest changes can be related to glacial/interglacial cycles within the current ice age. Although the glacial cycles are most directly caused by changes in the Earth's orbit (i.e. Milankovitch cycles), these changes also influence the carbon cycle, which in turn feeds back into the glacial system.
Since the Industrial Revolution, circa 1900, the burning of fossil fuels has caused a dramatic increase of CO2 in the atmosphere, reaching levels unprecedented in the last 400 thousand years. This increase has been implicated as a primary cause of global warming.
The spacing of carbon dioxide samples varies through time. At the present, the atmosphere is sampled routinely (at least daily) and complete annual averages are available. From the four ice cores presented on this plot the sampling varies from as rapid as one point every few years (recent parts of the Law Dome record) to as sparse as one sample every few thousand years (oldest parts of the Vostok record). In principle, the sparse sampling in the oldest parts of the record could hide abrupt excursions; however, isotopic measurements of ice cores (which are made continuously along the entire core) and our current understanding of the rates of natural processes for creating and removing carbon dioxide from the atmosphere make it unlikely that any positive excursions in carbon dioxide comparable to the Industrial Revolution have happened during the interval presented above.
 |
This graph image could be recreated using vector graphics as an SVG file. This has several advantages; see Commons:Media for cleanup for more information. If an SVG form of this image is already available, please upload it. After uploading an SVG, replace this template with {{ vector version available|new image name.svg}}. |
Copyright
This figure was prepared by Robert A. Rohde from publicly available data and is incorporated into the Global Warming Art project.
 |
Permission is granted to copy, distribute and/or modify this document under the terms of the GNU Free Documentation License, Version 1.2 or any later version published by the Free Software Foundation; with no Invariant Sections, no Front-Cover Texts, and no Back-Cover Texts. A copy of the license is included in the section entitled GNU Free Documentation License.
|
| This file is licensed under the Creative Commons Attribution-Share Alike 3.0 Unported license. | ||
|
||
| This licensing tag was added to this file as part of the GFDL licensing update.
|
Data Sources
- (blue) Vostok ice core: Fischer, H., M. Wahlen, J. Smith, D. Mastroianni, and B. Deck (1999). "Ice core records of Atmospheric CO2 around the last three glacial terminations". Science 283: 1712-1714.
- (green) EPICA ice core: Monnin, E., E.J. Steig, U. Siegenthaler, K. Kawamura, J. Schwander, B. Stauffer, T.F. Stocker, D.L. Morse, J.-M. Barnola, B. Bellier, D. Raynaud, and H. Fischer (2004). "Evidence for substantial accumulation rate variability in Antarctica during the Holocene, through synchronization of CO2 in the Taylor Dome, Dome C and DML ice cores". Earth and Planetary Science Letters 224: 45-54. doi: 10.1016/j.epsl.2004.05.007
- (red) Law Dome ice core: D.M. Etheridge, L.P. Steele, R.L. Langenfelds, R.J. Francey, J.-M. Barnola and V.I. Morgan (1998) "Historical CO2 records from the Law Dome DE08, DE08-2, and DSS ice cores" in Trends: A Compendium of Data on Global Change. Carbon Dioxide Information Analysis Centre, Oak Ridge National Laboratory, U.S. Department of Energy, Oak Ridge, Tenn., U.S.A.
- (cyan) Siple Dome ice core: Neftel, A., H. Friedli, E. Moor, H. Lötscher, H. Oeschger, U. Siegenthaler, and B. Stauffer (1994) "Historical CO2 record from the Siple Station ice core" in Trends: A Compendium of Data on Global Change. Carbon Dioxide Information Analysis Centre, Oak Ridge National Laboratory, U.S. Department of Energy, Oak Ridge, Tenn., U.S.A.
- (black) Mauna Loa Observatory, Hawaii: Keeling, C.D. and T.P. Whorf (2004) "Atmospheric CO2 records from sites in the SIO air sampling network" in Trends: A Compendium of Data on Global Change. Carbon Dioxide Information Analysis Centre, Oak Ridge National Laboratory, U.S. Department of Energy, Oak Ridge, Tenn., U.S.A.
Related images
-
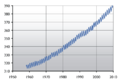
Expanded record of CO2 from the last 50 years at Mauna Loa
-
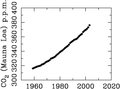
CO2 at Mauna Loa since 1958.
-
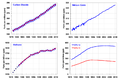
Trends of major greenhouse gases.
-
Solar variation and greenhouse gases during 420,000 years.
-
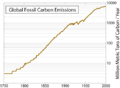
Recent global CO2 emissions, logarithmic scale.
-
Carbon dioxide variations during the last 550 million years.
Other language
File usage
Metadata
Find out about Schools Wikipedia
Through Schools Wikipedia, SOS Children has brought learning to children around the world. By supporting vulnerable children right through to adulthood, SOS Children makes a lasting difference to the lives of thousands of people. Education is a key part of our work, and our schools provide high-quality teaching to the children in our care. There are many ways to help with SOS Children's Villages.