File:Alastair Cook test batting career v1.png

| This graph image was uploaded in a raster graphics format such as PNG, GIF, or JPEG. However, it contains information that could be stored more efficiently and/or accurately in the SVG format, as a vector graphic. If possible, please upload an SVG version of this image. After confirming it is of comparable quality, please replace all instances of the previous version throughout Wikipedia (noted under the "File links" header), tag the old version with |
 |
Summary
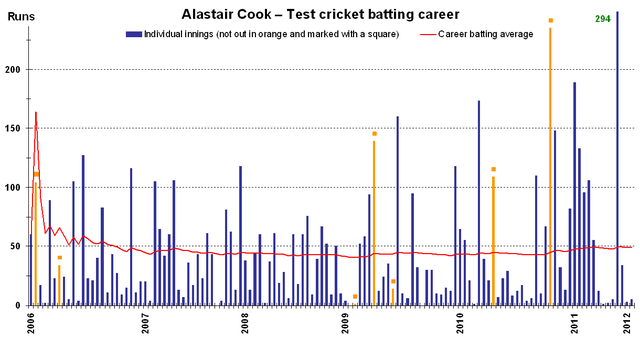
This graph details the test match performance of cricketer Alastair Cook and was created by en.wiki user:EdChem. Each bar indicates a single test match innings, blue ones for innings in which he was dismissed, orange ones (marked with a square) for innings in which he batted but was not out. The red line shows his career batting average as at the end of each innings. An alternative version, File:Alastair Cook test batting career v2.png instead shows his 10 innings moving average.
The graph was generated with Microsoft Excel 2003, the resulting chart being copied to Adobe Photoshop 9 and saved in .png format, using data from Cricinfo and Howstat . This version is current as at 24 January 2012, which is also the date it was prepared.
Licensing
|
I, the copyright holder of this work, hereby publish it under the following license:
|
 |
This is a candidate to be copied to Wikimedia Commons. Freely licensed or public domain media are more accessible to other Wikimedia projects if placed on Commons. Any user may perform this move—please see Moving files to the Commons for more information. Please thoroughly review the copyright status of this file and ensure that it is actually eligible for transfer to Commons. If you are concerned that this file could have problems with its attribution information and/or copyright status, then remove this notice and DO NOT transfer it to Commons. By transferring this file to Commons, you acknowledge you have read this message and are willing to accept any and all consequences for inappropriate transfers. Repeat violators will be blocked from editing. If you have checked the file and it is OK to move to Commons add "|human=username" to the template so other users can see it has been checked and can help you copy the file to Commons. If the file has already been moved to Commons, then consider nominating the file for deletion or changing the template to {{Now Commons}} If the file can't be moved to Commons because it doesn't fit Commons' scope, then use {{Do not move to Commons|reason=Why it can't be moved to Commons}} If you think that a local copy of this file should be kept, then use {{Keep local}}. Consider using {{Keep local|reason=Why the English Wikipedia needs a local copy}} Copy to Commons: via CommonsHelper |
||
|
|||
File usage
Metadata
Find out about Schools Wikipedia
Through Schools Wikipedia, SOS Children's Villages has brought learning to children around the world. By supporting vulnerable children right through to adulthood, SOS Childrens Villages makes a lasting difference to the lives of thousands of people. Education is a key part of our work, and our schools provide high-quality teaching to the children in our care. Have you thought about sponsoring a child?
