
File:Fi real gdp growth.svg
Size of this preview: 640 × 427 pixels.
| |
This is a file from the Wikimedia Commons. Information from its description page there is shown below.
Commons is a freely licensed media file repository. You can help. |
Summary
| Description |
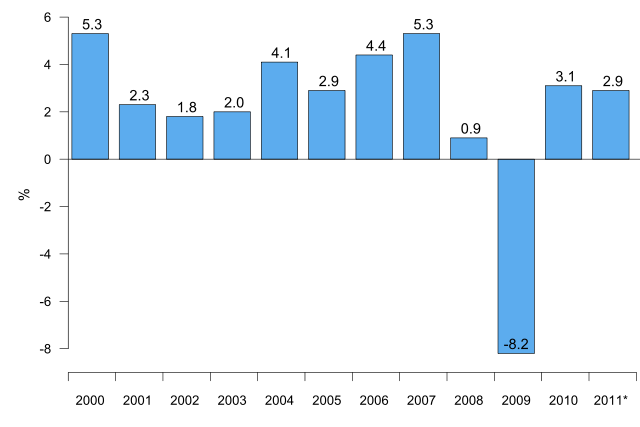
English: GDP in Finland, annual change in volume (asterix denotes forecast)
Suomi: Bruttokansantuotteen volyymin muutos Suomessa (tähdellä merkityt ennusteita)
|
| Date | 14 March 2011 |
| Source | Data: Eurostat, graph own work |
| Author | Jkv |
| Permission ( Reusing this file) |
PD-own |
R source
#R version 2.12, www.r-project.org
#Eurostat: Growth rate of GDP volume - percentage change on previous year
#Finland 2000 - 2011
#Date 2011/03/14
x <- c(5.3,2.3,1.8,2.0,4.1,2.9,4.4,5.3,0.9,-8.2,3.1,2.9)
names(x) <- c(2000:2010,"2011*")
library("Cairo")
CairoSVG("fi_real_gdp_growth.svg", width = 15, height = 10)
par(mar=c(3.2,4,1,0),las=1,mgp=c(2.2,1,0),cex=2,cex.axis=.9)
y <- barplot(x,ylim=c(-9,6),xlim=c(.2,15.9),ylab="%",
             space=.3,col="steelblue2",xaxs="i")
text(y,x+.4,format(x,digits=2))
axis(1,c(.2,y+.7),labels=F)
abline(h=0)
dev.off()
Licensing
 |
I, the copyright holder of this work, release this work into the public domain. This applies worldwide. In some countries this may not be legally possible; if so: I grant anyone the right to use this work for any purpose, without any conditions, unless such conditions are required by law.
|
File usage
The following pages on Schools Wikipedia link to this image (list may be incomplete):
Metadata
Schools Wikipedia and SOS Children
This selection has made Wikipedia available to all children. Thanks to SOS Childrens Villages, 62,000 children are enjoying a happy childhood, with a healthy, prosperous future ahead of them. Have you heard about child sponsorship? Learn more...