 |
This is a file from the Wikimedia Commons. Information from its description page there is shown below.
Commons is a freely licensed media file repository. You can help.
|
Summary
| Description |
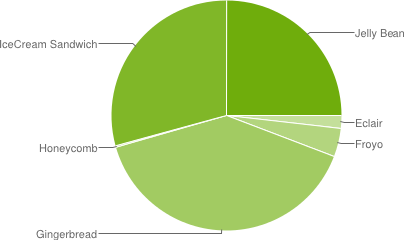
English: The following chart - presents the prevalence of various Android versions. It is based on the number of Android devices that have accessed the Play Store, with data collected during a 14-day period ending on December 3, 2012.
|
| Date |
December 03 2012 |
| Source |
http://developer.android.com/about/dashboards/index.html |
| Author |
Android Open Source project |
Permission
( Reusing this file) |

 |
This file is licensed under the Creative Commons Attribution 2.5 Generic license. |
|
|
|
- You are free:
- to share – to copy, distribute and transmit the work
- to remix – to adapt the work
- Under the following conditions:
- attribution – You must attribute the work in the manner specified by the author or licensor (but not in any way that suggests that they endorse you or your use of the work).
http://creativecommons.org/licenses/by/2.5 CC-BY-2.5 Creative Commons Attribution 2.5 truetrue
|
|
 |
This diagram image could be recreated using vector graphics as an SVG file. This has several advantages; see Commons:Media for cleanup for more information. If an SVG form of this image is already available, please upload it. After uploading an SVG, replace this template with {{ vector version available|new image name.svg}}. |
Licensing

 |
This file is licensed under the Creative Commons Attribution 2.5 Generic license. |
|
|
|
- You are free:
- to share – to copy, distribute and transmit the work
- to remix – to adapt the work
- Under the following conditions:
- attribution – You must attribute the work in the manner specified by the author or licensor (but not in any way that suggests that they endorse you or your use of the work).
http://creativecommons.org/licenses/by/2.5 CC-BY-2.5 Creative Commons Attribution 2.5 truetrue
|
DAADFAF
File usage
The following pages on Schools Wikipedia link to this image (list may be incomplete):


