 |
This is a file from the Wikimedia Commons. Information from its description page there is shown below.
Commons is a freely licensed media file repository. You can help.
|
Summary
| Description |
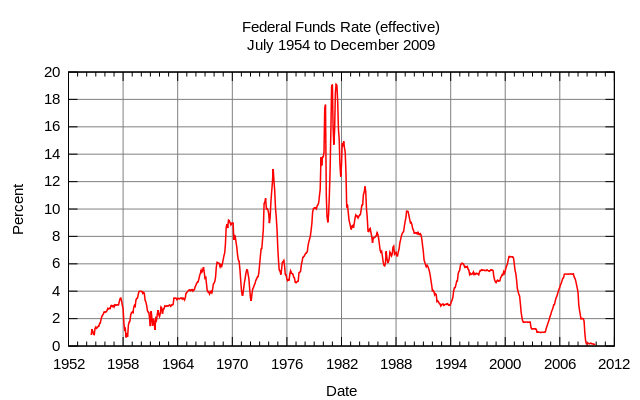
English: Historical chart of the U.S. federal funds rate. Metadata in the source data:
-
- Instrument
- Federal funds
- Maturity
- Overnight
- Frequency
- Monthly
- Description
- Federal funds effective rate
- Note
- The daily effective federal funds rate is a weighted average of rates on brokered trades. Weekly figures are averages of 7 calendar days ending on Wednesday of the current week; monthly figures include each calendar day in the month. Annualized using a 360-day year or bank interest.
|
| Date |
|
| Source |
Own work using data from the Federal Reserve The gnuplot source code used to generate the graph is found here |
| Author |
Kbh3rd |
Licensing
I, the copyright holder of this work, hereby publish it under the following licenses:
 |
Permission is granted to copy, distribute and/or modify this document under the terms of the GNU Free Documentation License, Version 1.2 or any later version published by the Free Software Foundation; with no Invariant Sections, no Front-Cover Texts, and no Back-Cover Texts. A copy of the license is included in the section entitled GNU Free Documentation License. http://www.gnu.org/copyleft/fdl.htmlGFDLGNU Free Documentation Licensetruetrue
|
You may select the license of your choice.
|
This file contains additional information, probably added from the digital camera or scanner used to create or digitize it. If the file has been modified from its original state, some details may not fully reflect the modified file.
SOS Children's Villages chose the best bits of Wikipedia to help you learn. In 133 nations around the world, SOS Childrens Villages works to bring better education and healthcare to families in desperate need of support. Have you thought about sponsoring a child?


