
File:Annual world greenhouse gas emissions, in 2005, by sector.png
Size of this preview: 509 × 480 pixels.
| |
This is a file from the Wikimedia Commons. Information from its description page there is shown below.
Commons is a freely licensed media file repository. You can help. |
Summary
| Description |
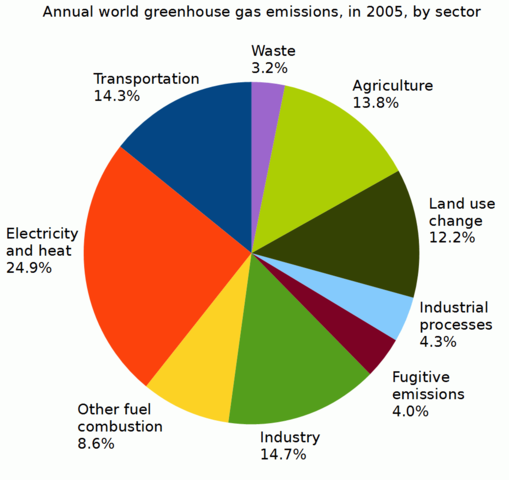
English: This pie chart shows annual world greenhouse gas emissions, in 2005, by sector. Emissions are measured as a percentage of total world carbon dioxide equivalent emissions:
Emissions due to land-use change include both emissions and absorptions (i.e., processes that both add to and remove carbon from the atmosphere). Emissions due to land-use change are highly uncertain. References:
|
| Date | 23 November 2012 |
| Source | Own work |
| Author | Enescot |
Data
Data from Herzog (2009) are given below as comma-separated values (CSV). The data were exported from OpenOffice 3.4.1 Calc using the following options (enclosed in braces): Character set: {Western Europe (Windows-1252/WinLatin}; Field delimiter: {,}; text delimiter: {"}.
,,
,,
,Sector,Percentage
,Transportation,14.3
,Electricity and heat,24.9
,Other fuel combustion,8.6
,Industry,14.7
,Fugitive emissions,4
,Industrial processes,4.3
,Land use change,12.2
,Agriculture,13.8
,Waste,3.2
Licensing
|
 |
This graph image could be recreated using vector graphics as an SVG file. This has several advantages; see Commons:Media for cleanup for more information. If an SVG form of this image is already available, please upload it. After uploading an SVG, replace this template with {{ vector version available|new image name.svg}}. |
File usage
The following pages on Schools Wikipedia link to this image (list may be incomplete):
Metadata
Schools Wikipedia facts
Schools Wikipedia has made the best of Wikipedia available to students. SOS Children's Villages is there for the children in our care until they are ready for independence. There are many ways to help with SOS Children's Villages.