
File:Linear least squares.svg
Size of this preview: 395 × 479 pixels.
| |
This is a file from the Wikimedia Commons. Information from its description page there is shown below.
Commons is a freely licensed media file repository. You can help. |
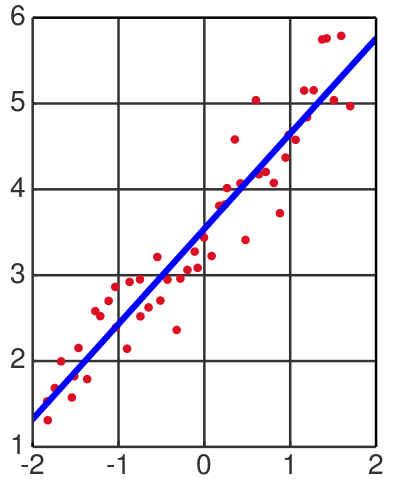
| Description | Illustration of linear least squares. |
| Date | 19:15, 2 February 2008 (UTC) |
| Source | self-made with MATLAB, tweaked in Inkscape. |
| Author | Oleg Alexandrov |
|
|
This chart was created with MATLAB. |
 |
I, the copyright holder of this work, release this work into the public domain. This applies worldwide. In some countries this may not be legally possible; if so: I grant anyone the right to use this work for any purpose, without any conditions, unless such conditions are required by law.
|
Source code ( MATLAB)
% Illustration of linear least squares.
function main()

   % KSmrq's colors
   red    = [0.867 0.06 0.14];
   blue   = [0, 129, 205]/256;
   green  = [0, 200,  70]/256;
   yellow = [254, 194,   0]/256;
   white = 0.99*[1, 1, 1];
   gray = 0.2*white;

% Set up the grid and other parameters
   N = 100;
   A = -2.2; B = 2;
   X = linspace(A, B, N);
   C=-4; D = 4;

   % Set up the figure
   lw = 4; % linewidth
   fs = 18; % font size
   figure(1); clf; hold on;
   set(gca, 'fontsize', fs);
   set(gca, 'linewidth', lw/2.5)
   hold on; grid on;

   % random numbers
   a = 1.1; b = 3.5; c = 1.4;
   M = 50;
   XX=linspace(A+0.3, B-0.3, M+1);
   Xr = 0*(1:M);
   Yr = Xr;
   for i=1:M
      r=rand(1);
      Xr(i) = XX(i)*r+XX(i+1)*(1-r);
      Yr(i) = a*Xr(i) + b + c*0.4*erfinv(2*rand(1) - 1);
   end

   myrad = 0.05;
   for i=1:length(Xr)
      ball(Xr(i), Yr(i), myrad, red);
   end


   % least squares fitting
   Yr = Yr';
   Mat = [Xr' (0*Xr+1)'];
   V=Mat'*Yr;
   V=(Mat'*Mat)\V;
   ae = V(1); be = V(2);
   plot(X, ae*X+be, 'b', 'linewidth', lw);

   grid on;
   set(gca, 'GridLineStyle', '-', 'xcolor', gray);
   set(gca, 'GridLineStyle', '-', 'ycolor', gray);
   set(gca, 'XTick', [-2 -1 0 1 2]);


   axis equal;
   axis([-2, 2, 1, 6]);

   saveas(gcf, 'Linear_least_squares.eps', 'psc2'); % save as eps
   %plot2svg('Linear_least_squares.svg'); % save as svg


function ball(x, y, r, colour)
   Theta=0:0.1:2*pi;
   X=r*cos(Theta)+x;
   Y=r*sin(Theta)+y;
   H=fill(X, Y, colour);
   set(H, 'EdgeColor', 'none');
|lang1=en|wiki1=wikipedia|article1=Linear_regression |lang2=it|wiki2=wikipedia|article2=Minimi_Quadrati |gallery1=Control theory }}
File usage
The following pages on Schools Wikipedia link to this image (list may be incomplete):
Metadata
Want to know more?
Wikipedia for Schools was collected by SOS Childrens Villages. SOS Children's Villages is famous for the love and shelter it brings to lone children, but we also support families in the areas around our Children's Villages, helping those who need us the most. Will you help another child today?