Checked content

File:2006 Global Water Availability.svg
Summary

Description
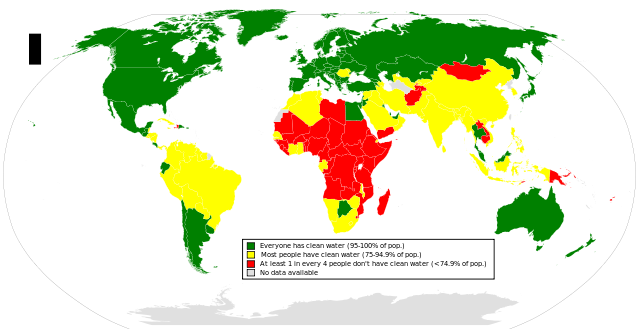
English: This is a map based off of File:Water quality.jpg but recreated from scratch in svg format. It shows the population of a country that uses improved water sources as a percent of total population. Data gathered from UNDP as of 2006.
Date 10 August 2012
Source Own work
Author OmnipotentArchetype0309

Older version at File:Water quality.jpg

Licensing

I, the copyright holder of this work, hereby publish it under the following license:
w:en:Creative Commons
attribution share alike
This file is licensed under the Creative Commons Attribution-Share Alike 3.0 Unported license.
You are free:
  • to share – to copy, distribute and transmit the work
  • to remix – to adapt the work
Under the following conditions:
  • attribution – You must attribute the work in the manner specified by the author or licensor (but not in any way that suggests that they endorse you or your use of the work).
  • share alike – If you alter, transform, or build upon this work, you may distribute the resulting work only under the same or similar license to this one.

The following pages on Schools Wikipedia link to this image (list may be incomplete):

Metadata

Background information

SOS Childrens Villages chose the best bits of Wikipedia to help you learn. More than 2 million people benefit from the global charity work of SOS Childrens Villages, and our work in 133 countries around the world is vital to ensuring a better future for vulnerable children. Would you like to sponsor a child?