
File:Solar evolution (English).svg
| |
This is a file from the Wikimedia Commons. Information from its description page there is shown below.
Commons is a freely licensed media file repository. You can help. |
Summary
| Description |
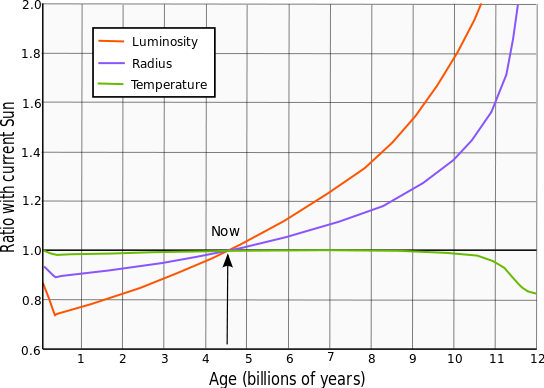
English: This graph shows the evolution of the Sun's luminosity, radius and effective temperature compared to the present Sun. The left edge represents the zero-age main sequence, while the right is the start of the red giant phase.
|
| Date | 30 September 2011 |
| Source | Own work, based on figure 1, Ribas, Ignasi (2010), "The Sun and stars as the primary energy input in planetary atmospheres", Solar and Stellar Variability: Impact on Earth and Planets, Proceedings of the International Astronomical Union, IAU Symposium, 264, pp. 3–18, en:Bibcode 2010IAUS..264....3R |
| Author | RJHall |
Licensing
|
File usage
The following pages on Schools Wikipedia link to this image (list may be incomplete):
Metadata
Learn more
Through Schools Wikipedia, SOS Children's Villages has brought learning to children around the world. More than 2 million people benefit from the global charity work of SOS Childrens Villages, and our work in 133 countries around the world is vital to ensuring a better future for vulnerable children. Will you help another child today?