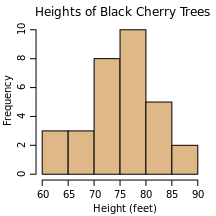
File:Black cherry tree histogram.svg

| |
This is a file from the Wikimedia Commons. Information from its description page there is shown below.
Commons is a freely licensed media file repository. You can help. |
Based on the following R code:
pdf("Black_cherry_tree_histogram.pdf", 3, 3, pointsize=10)
par(mgp=c(1.9,.7,0), mar=c(3,3,2,1), lend=1, ljoin=1, lmitre=4)

hist(trees$Height, col="burlywood",
     xlab="Height (feet)",
     main="Heights of Black Cherry Trees")

dev.off()
The figure was then edited slightly in Adobe Illustrator, then saved in SVG format.
Information regarding the dataset can be obtained from the R prompt:
?trees
The complete dataset is also provided in the following table:
> trees
   Girth Height Volume
1    8.3     70   10.3
2    8.6     65   10.3
3    8.8     63   10.2
4   10.5     72   16.4
5   10.7     81   18.8
6   10.8     83   19.7
7   11.0     66   15.6
8   11.0     75   18.2
9   11.1     80   22.6
10  11.2     75   19.9
11  11.3     79   24.2
12  11.4     76   21.0
13  11.4     76   21.4
14  11.7     69   21.3
15  12.0     75   19.1
16  12.9     74   22.2
17  12.9     85   33.8
18  13.3     86   27.4
19  13.7     71   25.7
20  13.8     64   24.9
21  14.0     78   34.5
22  14.2     80   31.7
23  14.5     74   36.3
24  16.0     72   38.3
25  16.3     77   42.6
26  17.3     81   55.4
27  17.5     82   55.7
28  17.9     80   58.3
29  18.0     80   51.5
30  18.0     80   51.0
31  20.6     87   77.0
References
- Ryan, T. A., Joiner, B. L. and Ryan, B. F. (1976) The Minitab Student Handbook. Duxbury Press.
|
|
This chart was created with R. |
Licensing
|
derivative works
Derivative works of this file:
File usage
Metadata
| Width | 216 |
|---|---|
| Height | 216 |
Find out more
This selection has made Wikipedia available to all children. In 133 nations around the world, SOS Childrens Villages works to bring better education and healthcare to families in desperate need of support. Want to learn more? Go to http://www.soschildrensvillages.org.uk/sponsor-a-child

