
File:AntarcticBedrock.jpg
Size of this preview: 480 × 480 pixels.
| |
This is a file from the Wikimedia Commons. Information from its description page there is shown below.
Commons is a freely licensed media file repository. You can help. |
Summary
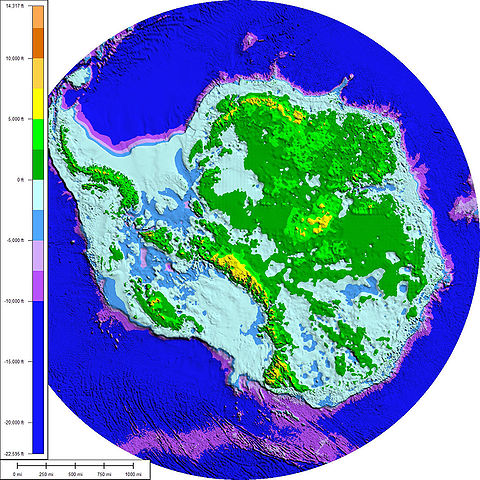
| Description | The above map shows the subglacial topography and bathymetry of Antarctica. As indicated by the scale on left-hand side, the different shades of blue and purple indicate parts of the ocean floor and sub-ice bedrock, which are below sea level. The other colors indicate Antarctic bedrock lying above sea level. Each colour represents an interval of 2,500 feet in elevation. Map is not corrected for sea level rise or isostatic rebound, which would occur if the Antarctic ice sheet completely melted to expose the bedrock surface. |
| Date | 13 March 2008 |
| Source | This map was prepared from BEDMAP gridded data-set for bed-elevation south of 60 degrees S using Global Mapper 7.0.1. The faint rectilinear pattern seen in the shaded relief is an artifact of the gridding of data from linear seismic surveys. The data used to make this map came from "A new ice thickness and subglacial topographic model of the Antarctic" prepared by the BEDMAP Consortium, which is sponsored by the European Ice Sheet Modelling Initiative, Scientific Committee on Antarctic Research. |
| Author | Paul V. heinrich |
Licensing
|
File usage
The following pages on Schools Wikipedia link to this image (list may be incomplete):
Metadata
Schools Wikipedia and SOS Children
Learning is fun and easy with Schools Wikipedia. In 133 nations around the world, SOS Children works to bring better education and healthcare to families in desperate need of support. If you'd like to help, learn how to sponsor a child.