 |
This is a file from the Wikimedia Commons. Information from its description page there is shown below.
Commons is a freely licensed media file repository. You can help.
|
Summary
| Description |
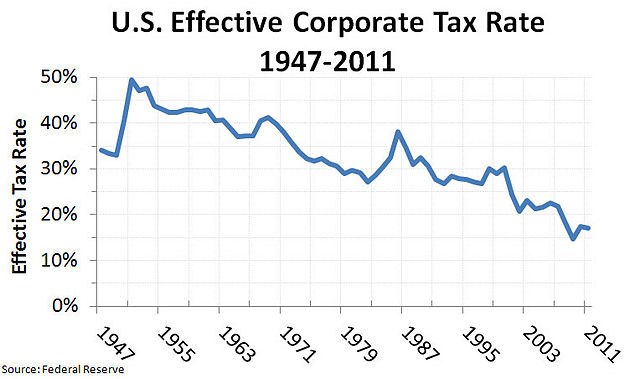
English: U.S. effective corporate tax rates, 1947–2012
|
| Date |
25 September 2012, 18:24:32 |
| Source |
Own work |
| Author |
Guest2625 |
Original Source: St. Louis Federal Reserve Bank, FRED® Economic Data, "Graph: Federal Government: Tax Receipts on Corporate Income (FCTAX)/(Corporate Profits After Tax (CP)+Federal Government: Tax Receipts on Corporate Income (FCTAX))"
Weblink: http://research.stlouisfed.org/fred2/graph/?g=aWA
See also original wikiupload by: Cupco
Weblink: http://commons.wikimedia.org/wiki/File%3AUS_effective_corp_tax_rate_1947-2012.png
Based on: Between The Balance Sheets blog, where graph was created "by combining the Corporate Profits After Tax data from the NIPA tables with the OMB’s data on the revenue collected by the corporate profit tax. The sum of these two series ought to equal total pre-tax profits (roughly), so from there it is easy to calculate the average effective tax rate." Compare to this FRED graph of identical annual data.
Weblink: http://betweenthebalancesheets.wordpress.com/2011/10/06/a-few-issues-with-u-s-corporate-tax-policy/
Licensing
|
I, the copyright holder of this work, hereby publish it under the following license:
|
File usage
The following pages on Schools Wikipedia link to this image (list may be incomplete):
This file contains additional information, probably added from the digital camera or scanner used to create or digitize it. If the file has been modified from its original state, some details may not fully reflect the modified file.


