 |
This is a file from the Wikimedia Commons. Information from its description page there is shown below.
Commons is a freely licensed media file repository. You can help.
|
| Description |
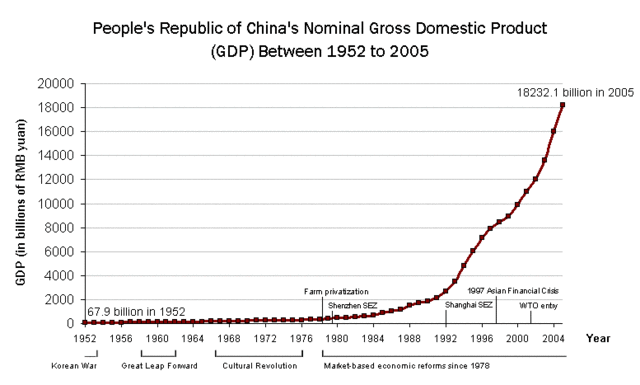
English: Scatter graph of the People's Republic of China's GDP between years 1952 to 2005, based on publicly available nominal GDP data published by the People's Republic of China and compiled by Hitotsubashi University (Japan) and confirmed by economic indicator statistics from the World Bank.
|
| Date |
2006-07-29 (first version); 2006-07-28 (last version) |
| Source |
Transferred from en.wikipedia |
| Author |
Original uploader was Intsokzen at en.wikipedia |
Permission
( Reusing this file) |
Released under the GNU Free Documentation License.
|
Licensing
Intsokzen at the English language Wikipedia, the copyright holder of this work, hereby publishes it under the following license:
 |
Permission is granted to copy, distribute and/or modify this document under the terms of the GNU Free Documentation License, Version 1.2 or any later version published by the Free Software Foundation; with no Invariant Sections, no Front-Cover Texts, and no Back-Cover Texts.
Subject to disclaimers.www.gnu.org/copyleft/fdl.htmlGFDLGNU Free Documentation Licensetruetrue
|
|
 |
This diagram image could be recreated using vector graphics as an SVG file. This has several advantages; see Commons:Media for cleanup for more information. If an SVG form of this image is already available, please upload it. After uploading an SVG, replace this template with {{ vector version available|new image name.svg}}. |
File usage
The following pages on Schools Wikipedia link to this image (list may be incomplete):
SOS Children's Villages aims to make Wikipedia suitable for young learners. SOS Children's Villages believes that a decent childhood is essential to a happy, healthy. Our community work brings families new opportunities through education, healthcare and all manner of support. Will you help another child today?


