 |
This is a file from the Wikimedia Commons. Information from its description page there is shown below.
Commons is a freely licensed media file repository. You can help.
|
Summary
| Description |
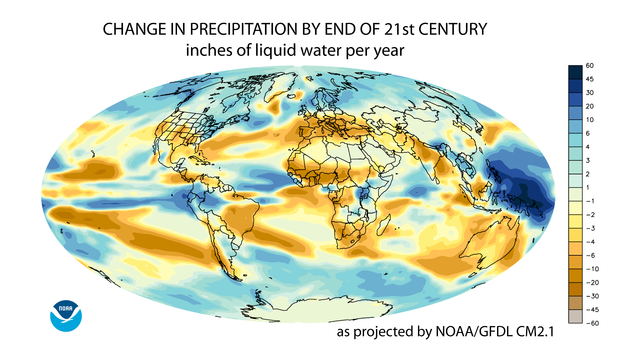
English: Based on NOAA (2007) public-domain source: This world map shows the change in annual average precipitation projected by the GFDL CM2.1 model for the 21st century. The change is in response to increasing atmospheric concentrations of greenhouse gases and aerosols based on a "middle of the road" estimate of future emissions. Future emissions are based on the "A1B" emissions scenario, taken from the Special Report on Emissions Scenarios. For the "A1B" emissions scenario, atmospheric carbon dioxide levels are projected to increase from 370 to 717 ppm. The plotted precipitation differences were computed as the difference between the 2081 to 2100 twenty year average minus the 1951 to 2000 fifty year average. Blue areas are projected to see an increase in annual precipitation amounts. Brown areas are projected to receive less precipitation in the future. (Note the irregular colour bar intervals.)
Warming of the global climate is expected to be accompanied by a reduction in rainfall in the subtropics and an increase in precipitation in subpolar latitudes and some equatorial regions. This pattern can be described in broad terms as the wet getting wetter and the dry getting drier, since subtropical land regions are mostly semi-arid today, while most subpolar regions currently have an excess of precipitation over evaporation. Though clearly a feature of a warming global climate, this characterization of the changing precipitation pattern cannot be applied to every locale, but should instead be thought of as a large-scale tendency that can be modified by local conditions in some cases. As seen in the map below, the drying is projected to be strongest near the poleward margins of the subtropics (for example, South Africa, southern Australia, the Mediterranean, and the south-western U.S.), a pattern that can be described as a poleward expansion of these semi-arid zones.
This large-scale pattern of change is a robust feature present in nearly all of the simulations conducted by the world's climate modeling groups for the 4th Assessment of the Intergovernmental Panel on Climate Change (IPCC), including those conducted at NOAA’s Geophysical Fluid Dynamics Laboratory (GFDL). It is also evident in observed 20th century precipitation trends.
In the map, changes are measured in inches of liquid water per year, ranging from +60 to -60. As described above, changes are not uniform globally. Most areas which see increases in precipitation are in the range of +1 to +30. Most areas which see decreases are in the range of -1 to -45.
References:
- NOAA, February 2007: GFDL Climate Modeling Research Highlights: Will the wet get wetter and the dry drier? (PDF), vol. 1, no. 5, revision 10/15/2008, 4:47:16 PM. The National Oceanic and Atmospheric Administration (NOAA) Geophysical Fluid Dynamics Laboratory (GFDL) - Princeton, NJ, USA
|
| Date |
9 October 2012 |
| Source |
Higher Resolution Version 1920 x 1080 png (840KB), in: Geophysical Fluid Dynamics Laboratory - Will the Wet Get Wetter and the Dry Drier, publisher: NOAA GFDL. Retrieved 2012-10-13. |
| Author |
NOAA Geophysical Fluid Dynamics Laboratory (GFDL) |
Permission
( Reusing this file) |
From cited the cited source: "The materials presented here help illustrate some of the key research results that GFDL scientists have reported on recently. These graphics are considered to be in the public domain, and thus can be downloaded freely. We do request that if these images are used in publications or media broadcasts credit be given to "NOAA Geophysical Fluid Dynamics Laboratory" or at least "NOAA GFDL"."
|
Licensing
| Public domainPublic domainfalsefalse |
 |
This image is in the public domain because it contains materials that originally came from the U.S. National Oceanic and Atmospheric Administration, taken or made as part of an employee's official duties.
|
|
File usage
The following pages on Schools Wikipedia link to this image (list may be incomplete):
This file contains additional information, probably added from the digital camera or scanner used to create or digitize it. If the file has been modified from its original state, some details may not fully reflect the modified file.


