 |
This is a file from the Wikimedia Commons. Information from its description page there is shown below.
Commons is a freely licensed media file repository. You can help.
|
 |
This image was selected as picture of the month on the Mathematics Portal for December 2011 |
Summary
| Description |
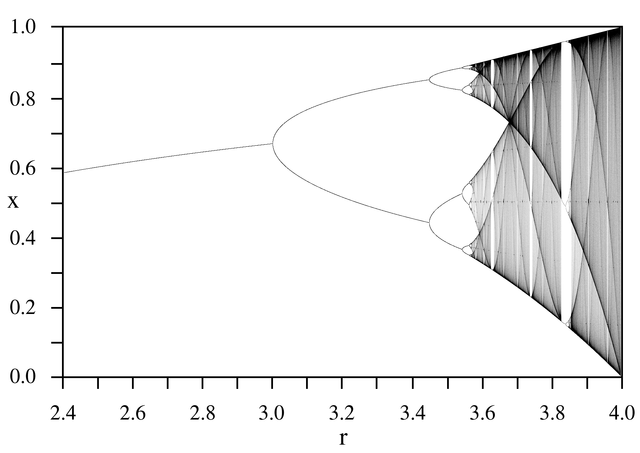
English: A bifurcation diagram for the Logistic map:
 The horizontal axis is the r parameter, the vertical axis is the x variable. The image was created by forming a 1601 x 1001 array representing increments of 0.001 in r and x. A starting value of x=0.25 was used, and the map was iterated 1000 times in order to stabilize the values of x. 100,000 x -values were then calculated for each value of r and for each x value, the corresponding (x,r) pixel in the image was incremented by one. All values in a column (corresponding to a particular value of r) were then multiplied by the number of non-zero pixels in that column, in order to even out the intensities. Values above 250,000 were set to 250,000, and then the entire image was normalized to 0-255. Finally, pixels for values of r below 3.57 were darkened to increase visibility.
|
| Date |
14 September 2005 |
| Source |
Own work |
| Author |
PAR |
Licensing
| Public domainPublic domainfalsefalse |
 |
I, the copyright holder of this work, release this work into the public domain. This applies worldwide.
In some countries this may not be legally possible; if so:
I grant anyone the right to use this work for any purpose, without any conditions, unless such conditions are required by law.Public domainPublic domainfalsefalse
|
File usage
The following pages on Schools Wikipedia link to this image (list may be incomplete):
Through Schools Wikipedia, SOS Children has brought learning to children around the world. SOS Children believes that a decent childhood is essential to a happy, healthy. Our community work brings families new opportunities through education, healthcare and all manner of support. Find out how you can help children in other countries.


