
File:Gamma distribution pdf.png
Size of this preview: 640 × 480 pixels.
| |
This is a file from the Wikimedia Commons. Information from its description page there is shown below.
Commons is a freely licensed media file repository. You can help. |
 |
File:Gamma distribution pdf.svg is a vector version of this file. It should be used in place of this raster image when superior. File:Gamma distribution pdf.png
For more information about vector graphics, read about Commons transition to SVG.
|
 |
Related links:
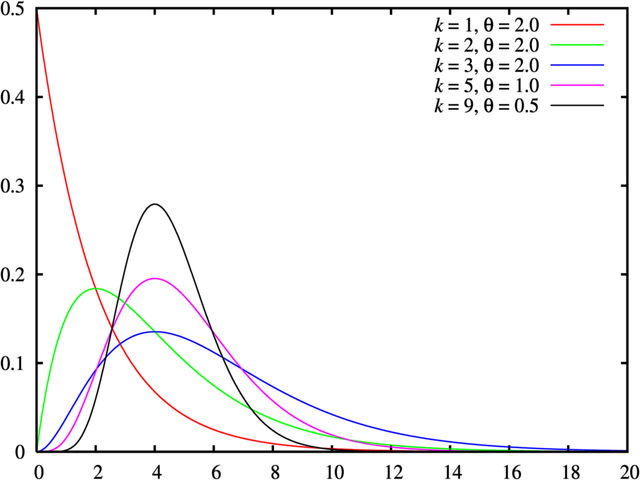
Probability density function for the Gamma distribution
 |
Permission is granted to copy, distribute and/or modify this document under the terms of the GNU Free Documentation License, Version 1.2 or any later version published by the Free Software Foundation; with no Invariant Sections, no Front-Cover Texts, and no Back-Cover Texts. A copy of the license is included in the section entitled GNU Free Documentation License.
|
| This file is licensed under the Creative Commons Attribution-Share Alike 3.0 Unported license. | ||
|
||
| This licensing tag was added to this file as part of the GFDL licensing update.
|
gnuplot source under GPL:
_ln_dgamma(x, a, b) = a*log(b) - lgamma(a) + (a-1)*log(x) - b*x
dgamma(x, shape, rate) =\
 (x<0)? 0 :\
 (x==0)? ((shape<1)? 1/0 : (shape==1)? rate : 0) :\
 (rate==0)? 0 :\
 exp(_ln_dgamma(x, shape, rate))
pgamma(x, shape, rate) = (x<0)? 0 : igamma(shape, x*rate)

set samples 1001
set terminal postscript enhanced color solid lw 2 "Times-Roman" 20
set output

set xtics 0,2
set ytics 0,0.1

f(x, k, t) = dgamma(x, k, 1.0/t)
set key top right

#f(x, k, t) = pgamma(x, k, 1.0/t)
#set key bottom right

plot [0:20] \
    f(x,1,2.0) title "{/Times-Italic k} = 1, {/Symbol q} = 2.0", \
    f(x,2,2.0) title "{/Times-Italic k} = 2, {/Symbol q} = 2.0", \
    f(x,3,2.0) title "{/Times-Italic k} = 3, {/Symbol q} = 2.0", \
    f(x,5,1.0) title "{/Times-Italic k} = 5, {/Symbol q} = 1.0", \
    f(x,9,0.5) title "{/Times-Italic k} = 9, {/Symbol q} = 0.5" lt 7
|
|
This vector image was created with gnuplot. |
|
This work is free software; you can redistribute it and/or modify it under the terms of the GNU General Public License as published by the Free Software Foundation; either version 2 of the License, or any later version. This work is distributed in the hope that it will be useful, but without any warranty; without even the implied warranty of merchantability or fitness for a particular purpose. See version 2 and version 3 of the GNU General Public License for more details. |
derivative works
Derivative works of this file:
File usage
The following pages on Schools Wikipedia link to this image (list may be incomplete):
More information
Schools Wikipedia was created by children's charity SOS Children. In 133 nations around the world, SOS Children's Villages works to bring better education and healthcare to families in desperate need of support. There are many ways to help with SOS Children.