
File:Mauna Loa Carbon Dioxide-en.svg
| |
This is a file from the Wikimedia Commons. Information from its description page there is shown below.
Commons is a freely licensed media file repository. You can help. |
![]() ✓ The source code of this SVG is valid.
✓ The source code of this SVG is valid.
Summary
| Description |
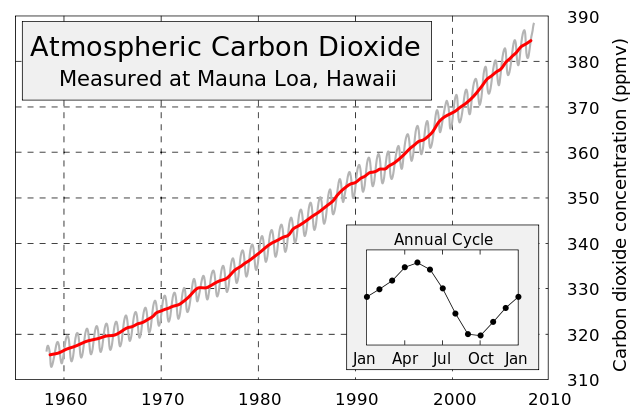
English: This figure shows the history of atmospheric carbon dioxide concentrations as directly measured at Mauna Loa, Hawaii. This curve is known as the Keeling curve, and is an essential piece of evidence of the man-made increases in greenhouse gases that are believed to be the cause of global warming. The longest such record exists at Mauna Loa, but these measurements have been independently confirmed at many other sites around the world .
The annual fluctuation in carbon dioxide is caused by seasonal variations in carbon dioxide uptake by land plants. Since many more forests are concentrated in the Northern Hemisphere, more carbon dioxide is removed from the atmosphere during Northern Hemisphere summer than Southern Hemisphere summer. This annual cycle is shown in the inset figure by taking the average concentration for each month across all measured years. The grey curve shows the average monthly concentrations, and red curve is a moving 12 month average.Français : Évolution de la teneur atmosphérique en dioxyde de carbone, mesurée depuis le volcan Mauna Loa, dans l' île de Hawaii. La courbe de cette évolution est connue sous le nom de « courbe de Keeling », et est une preuve évidente de la production humaine de gaz à effet de serre et de son impact sur le réchauffement climatique. C'est sur le Mauna Loa que les taux mesurés sont les plus élevés, mais on retrouve la même évolution sur d'autres sites dans le monde (voir ici).
La fluctuation annuelle de dioxyde de carbone est dûe aux variation saisonnière causées par les plantes. Comme beaucoup de forêts se trouvent dans l' hémisphère nord, il y a plus de rejet de gaz carbonique dans l'atmosphère durant l'été septentrional que pendant l'été austral. Ce cycle annuel est indiqué dans l'encart en bas à droite de l'image, et montre la concentration moyenne de gaz au cours des différents mois. Ce cycle se répète quelle que soit l'année observée. La courbe grise montre la teneur moyenne mensuelle de dioxyde de carbone, et la courbe rouge représente la moyenne annuelle. |
| Date | 23 April 2008 |
| Source | Own work, from Image:Mauna Loa Carbon Dioxide.png, uploaded in Commons by Nils Simon under licence GFDL & CC-NC-SA ; itself created by Robert A. Rohde from NOAA published data and is incorporated into the Global Warming Art project. |
| Author | Sémhur |
|
Camera location |
|
View this and other nearby images on: Google Maps - Google Earth - OpenStreetMap | ( Info) |
|---|
| |
This SVG file uses embedded text that can be easily translated into your language using this automated tool. Learn more. You can also download it and translate it manually using a text editor.
|
Licensing
|

File usage
Metadata
Background information
SOS Children's Villages chose the best bits of Wikipedia to help you learn. By supporting vulnerable children right through to adulthood, SOS Children's Villages makes a lasting difference to the lives of thousands of people. Education is a key part of our work, and our schools provide high-quality teaching to the children in our care. Find out how you can help children in other countries.