
File:Normal distribution cdf.png
Size of this preview: 640 × 480 pixels.
| |
This is a file from the Wikimedia Commons. Information from its description page there is shown below.
Commons is a freely licensed media file repository. You can help. |
 |
File:Normal Distribution CDF.svg is a vector version of this file. It should be used in place of this raster image when superior. File:Normal distribution cdf.png
For more information about vector graphics, read about Commons transition to SVG.
|
 |
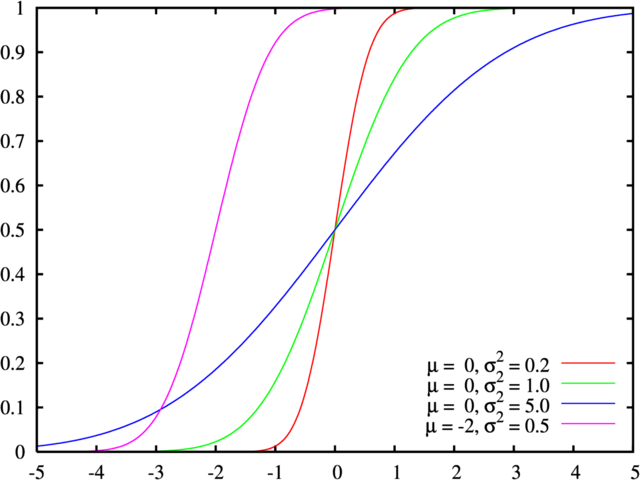
Cumulative distribution function for the normal distribution
 |
Permission is granted to copy, distribute and/or modify this document under the terms of the GNU Free Documentation License, Version 1.2 or any later version published by the Free Software Foundation; with no Invariant Sections, no Front-Cover Texts, and no Back-Cover Texts. A copy of the license is included in the section entitled GNU Free Documentation License.
|
| This file is licensed under the Creative Commons Attribution-Share Alike 3.0 Unported license. | ||
|
||
| This licensing tag was added to this file as part of the GFDL licensing update.
|
gnuplot source under GPL:
_ln_dnorm(x, m, s) = -0.5 * log(2*pi) - log(s) - 0.5*((x-m)*1.0/s)**2
dnorm(x, mean, sd) = exp(_ln_dnorm(x, mean, sd))
pnorm(x, mean, sd) = norm((x-mean) * 1.0/sd)

set samples 1001
set terminal postscript enhanced colour solid lw 2 "Times-Roman" 20
set output

set xrange [-5:5]
set xtics 1
set yrange [0:1]
set ytics 0.1

#f(x,y,z) = dnorm(x, y, sqrt(z)) #use variance, not sd!
#set key 3.8,0.94

f(x,y,z) = pnorm(x, y, sqrt(z))
set key 3.8,0.2

plot \
    f(x,  0, 0.2) title "{/Symbol m} =  0, {/Symbol s}^2 = 0.2", \
    f(x,  0, 1)   title "{/Symbol m} =  0, {/Symbol s}^2 = 1.0", \
    f(x,  0, 5)   title "{/Symbol m} =  0, {/Symbol s}^2 = 5.0", \
    f(x, -2, 0.5) title "{/Symbol m} = -2, {/Symbol s}^2 = 0.5"
|
This work is free software; you can redistribute it and/or modify it under the terms of the GNU General Public License as published by the Free Software Foundation; either version 2 of the License, or any later version. This work is distributed in the hope that it will be useful, but without any warranty; without even the implied warranty of merchantability or fitness for a particular purpose. See version 2 and version 3 of the GNU General Public License for more details. |
File usage
The following pages on Schools Wikipedia link to this image (list may be incomplete):
Schools Wikipedia facts
You can learn about nearly 6,000 different topics on Schools Wikipedia. SOS Childrens Villages helps more than 2 million people across 133 countries around the world. Have you heard about child sponsorship? Learn more...