Question: How is common-size analysis used to evaluate the financial health of an organization?
Answer: Common-size analysisAn analysis that converts each line of financial statement data to an easily comparable amount measured in percent form. Income statement items are stated as a percent of net sales, and balance sheet items are stated as a percent of total assets (or total liabilities and shareholders’ equity); also called vertical analysis. (also called vertical analysis) converts each line of financial statement data to an easily comparable, or common-size, amount measured as a percent. This is done by stating income statement items as a percent of net sales and balance sheet items as a percent of total assets (or total liabilities and shareholders’ equity). For example, Coca-Cola had net income of $11,809,000,000 and net sales of $35,119,000,000 for 2010. The common-size percent is simply net income divided by net sales, or 33.6 percent (= $11,809 ÷ $35,119).
There are two reasons to use common-size analysis: (1) to evaluate information from one period to the next within a company and (2) to evaluate a company relative to its competitors. Common-size analysis answers such questions as “how do our current assets as a percent of total assets compare with last year?” and “how does our net income as a percent of net sales compare with that of our competitors?”
Question: How is a formal common-size analysis prepared, and what does it tell us for Coca-Cola?
Answer: Figure 13.5 "Common-Size Income Statement Analysis for " presents the common-size analysis for Coca-Cola’s income statement, and Figure 13.6 "Common-Size Balance Sheet Analysis for " shows the common-size analysis for Coca-Cola’s balance sheet. As you look at these figures, notice that net sales are used as the base for the income statement, and total assets (or total liabilities and shareholders’ equity) are used as the base for the balance sheet. That is, for the income statement, each item is measured as a percent of net sales, and for the balance sheet, each item is measured as a percent of total assets (or total liabilities and shareholders’ equity).
Figure 13.5 Common-Size Income Statement Analysis for Coca-Cola
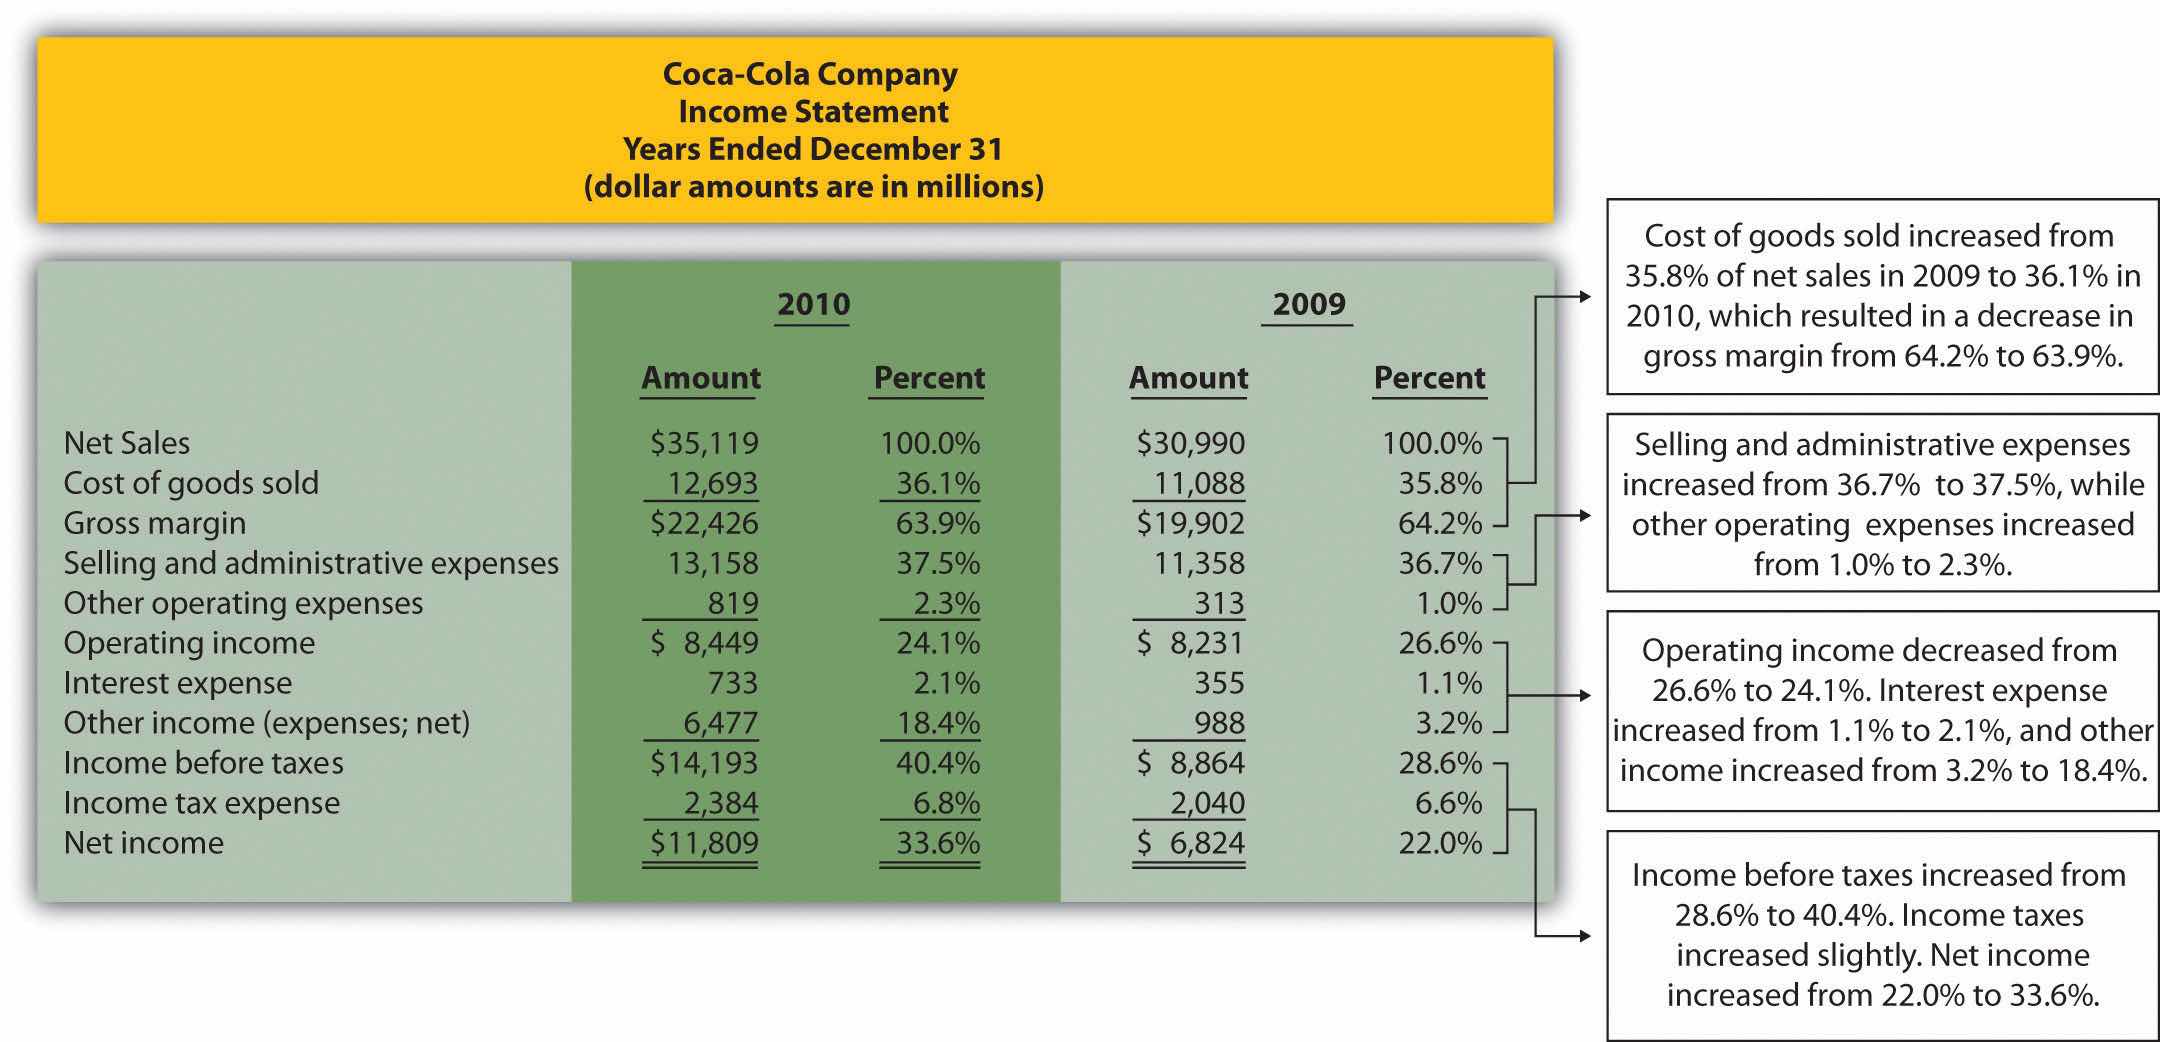
Note: All percentages use net sales as the base. For example, 2010 cost of goods sold percent of 36.1 percent equals $12,693 cost of goods sold ÷ $35,119 net sales. Note that rounding issues sometimes cause subtotals in the percent column to be off by a small amount.
In general, managers prefer expenses as a percent of net sales to decrease over time, and profit figures as a percent of net sales to increase over time. As you can see in Figure 13.5 "Common-Size Income Statement Analysis for ", Coca-Cola’s gross margin as a percent of net sales decreased from 2009 to 2010 (64.2 percent versus 63.9 percent). Operating income declined as well (26.6 percent versus 24.1 percent). Income before taxes increased significantly from 28.6 percent in 2009 to 40.4 percent in 2010, again mainly due to a one-time gain of $4,978,000,000 in 2010. This caused net income to increase as well, from 22.0 percent in 2009 to 33.6 percent in 2010. In the expense category, cost of goods sold as a percent of net sales increased, as did other operating expenses, interest expense, and income tax expense. Selling and administrative expenses increased from 36.7 percent in 2009 to 37.5 percent in 2010.
Figure 13.6 Common-Size Balance Sheet Analysis for Coca-Cola
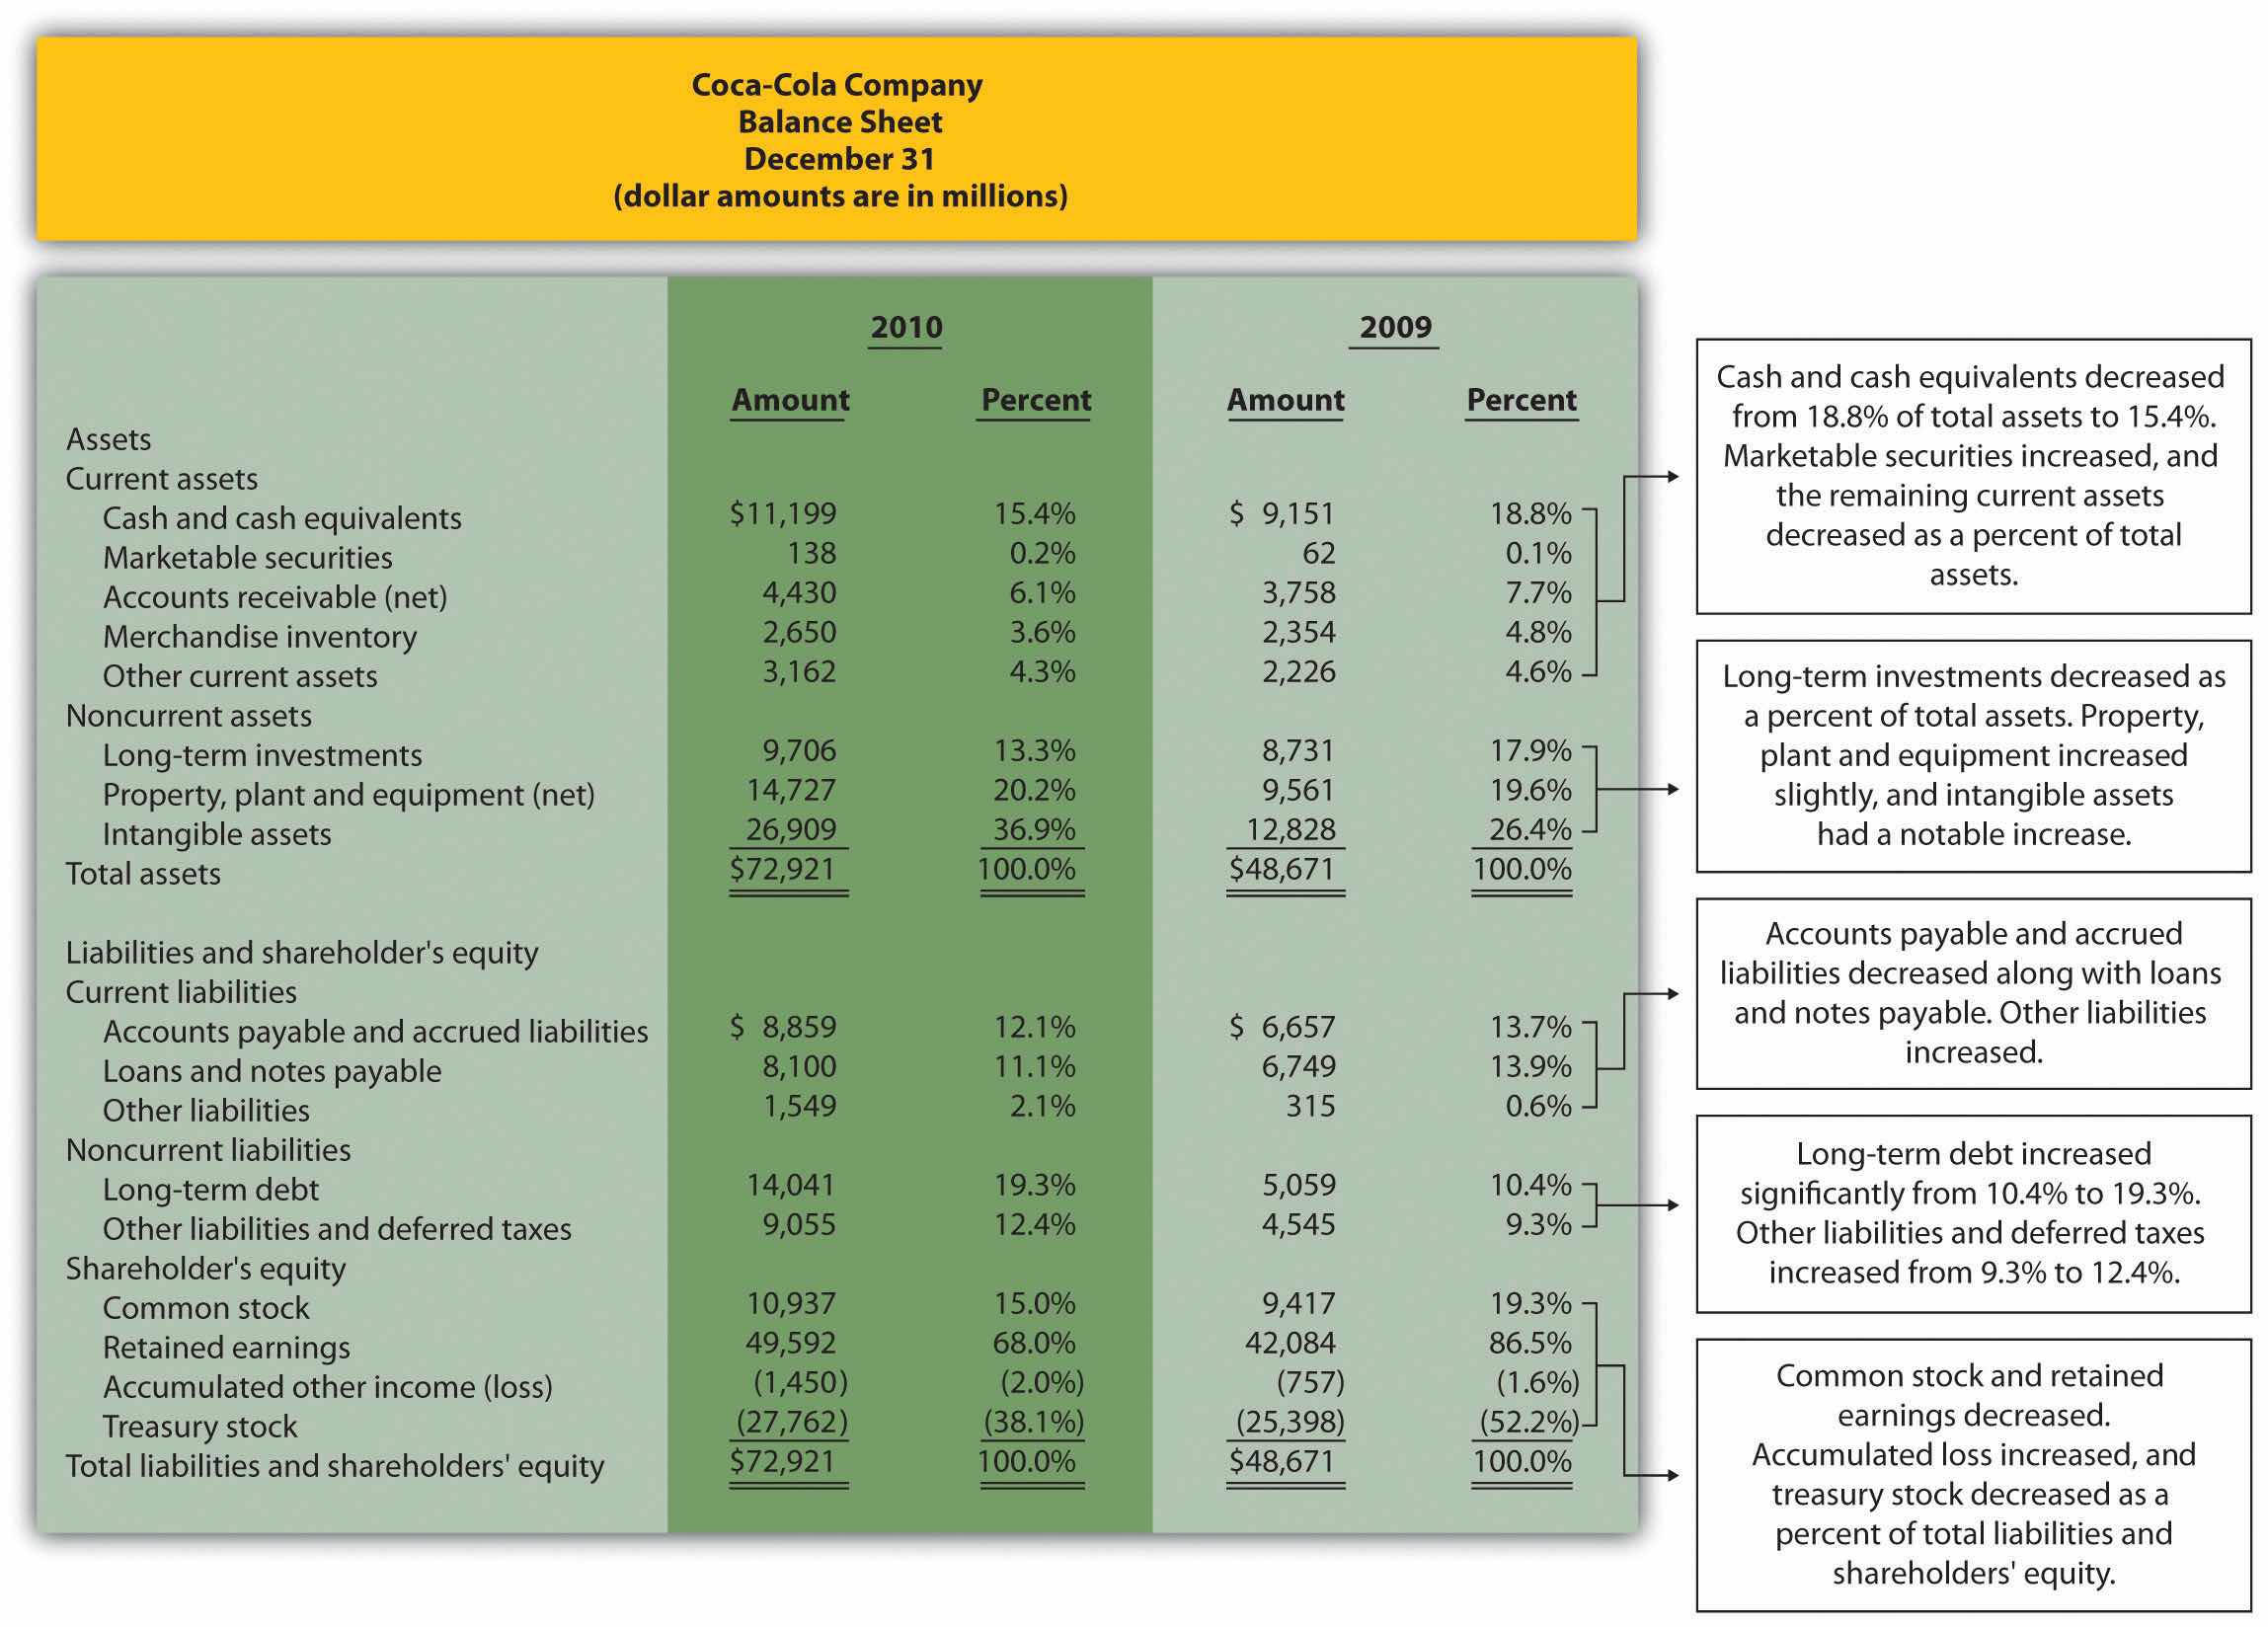
As you can see from Figure 13.6 "Common-Size Balance Sheet Analysis for ", the composition of assets, liabilities, and shareholders’ equity accounts changed from 2009 to 2010. Notable changes occurred for intangible assets (26.4 percent in 2009 versus 36.9 percent in 2010), long-term debt (10.4 percent in 2009 versus 19.3 percent in 2010), retained earnings (86.5 percent in 2009 versus 68.0 percent in 2010), and treasury stock (52.2 percent in 2009 versus 38.1 percent in 2010).
Question: To this point, we have used common-size analysis to evaluate just one company, Coca-Cola. Common-size analysis is, however, also an effective way of comparing two companies with different levels of revenues and assets. For example, suppose one company has operating income of $100,000, and a competing company has operating income of $2,000,000. If both companies have similar levels of net sales and total assets, it is reasonable to assume that the more profitable company is the better performer. However, most companies are not the same size. How do we compare companies of different sizes?
Answer: This is where common-size analysis can help. Figure 13.7 "Common-Size Income Statement Analysis for " shows an income statement comparison for Coca-Cola and PepsiCo using common-size analysis. (The information for Coca-Cola comes from Figure 13.5 "Common-Size Income Statement Analysis for ", and the information for PepsiCo comes from the solution to part 1 of Note 13.15 "Review Problem 13.2" at the end of this segment.)
Figure 13.7 Common-Size Income Statement Analysis for Coca-Cola and PepsiCo
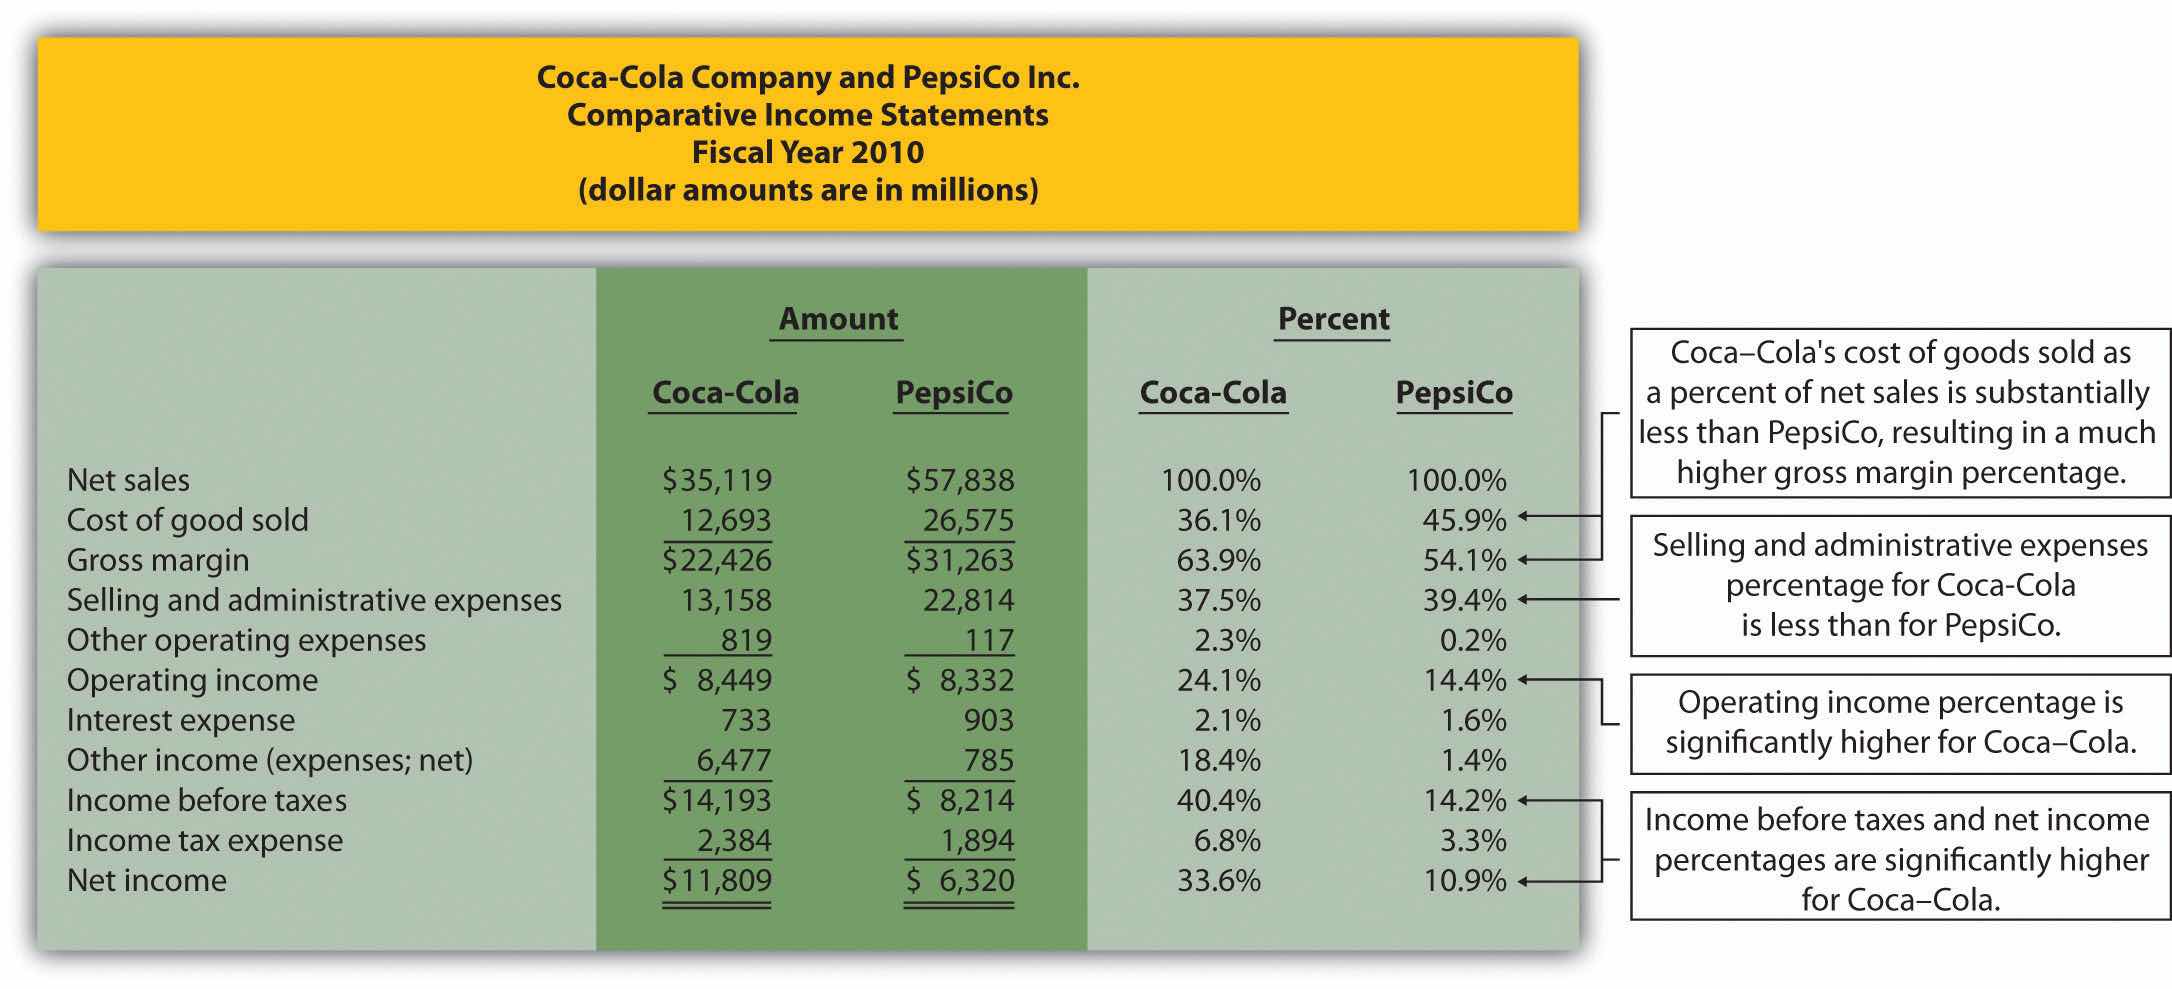
Note that rounding issues sometimes cause subtotals in the percent column to be off by a small amount.
Notice that PepsiCo has the highest net sales at $57,838,000,000 versus Coca-Cola at $35,119,000,000. Once converted to common-size percentages, however, we see that Coca-Cola outperforms PepsiCo in virtually every income statement category. Coca-Cola’s cost of goods sold is 36.1 percent of net sales compared to 45.9 percent at PepsiCo. Coca-Cola’s gross margin is 63.9 percent of net sales compared to 54.1 percent at PepsiCo. Coca-Cola’s operating income is 24.1 percent of sales compared to 14.4 percent at PepsiCo. Figure 13.8 "Comparison of Common-Size Gross Margin and Operating Income for " compares common-size gross margin and operating income for Coca-Cola and PepsiCo.
Figure 13.8 Comparison of Common-Size Gross Margin and Operating Income for Coca-Cola and PepsiCo
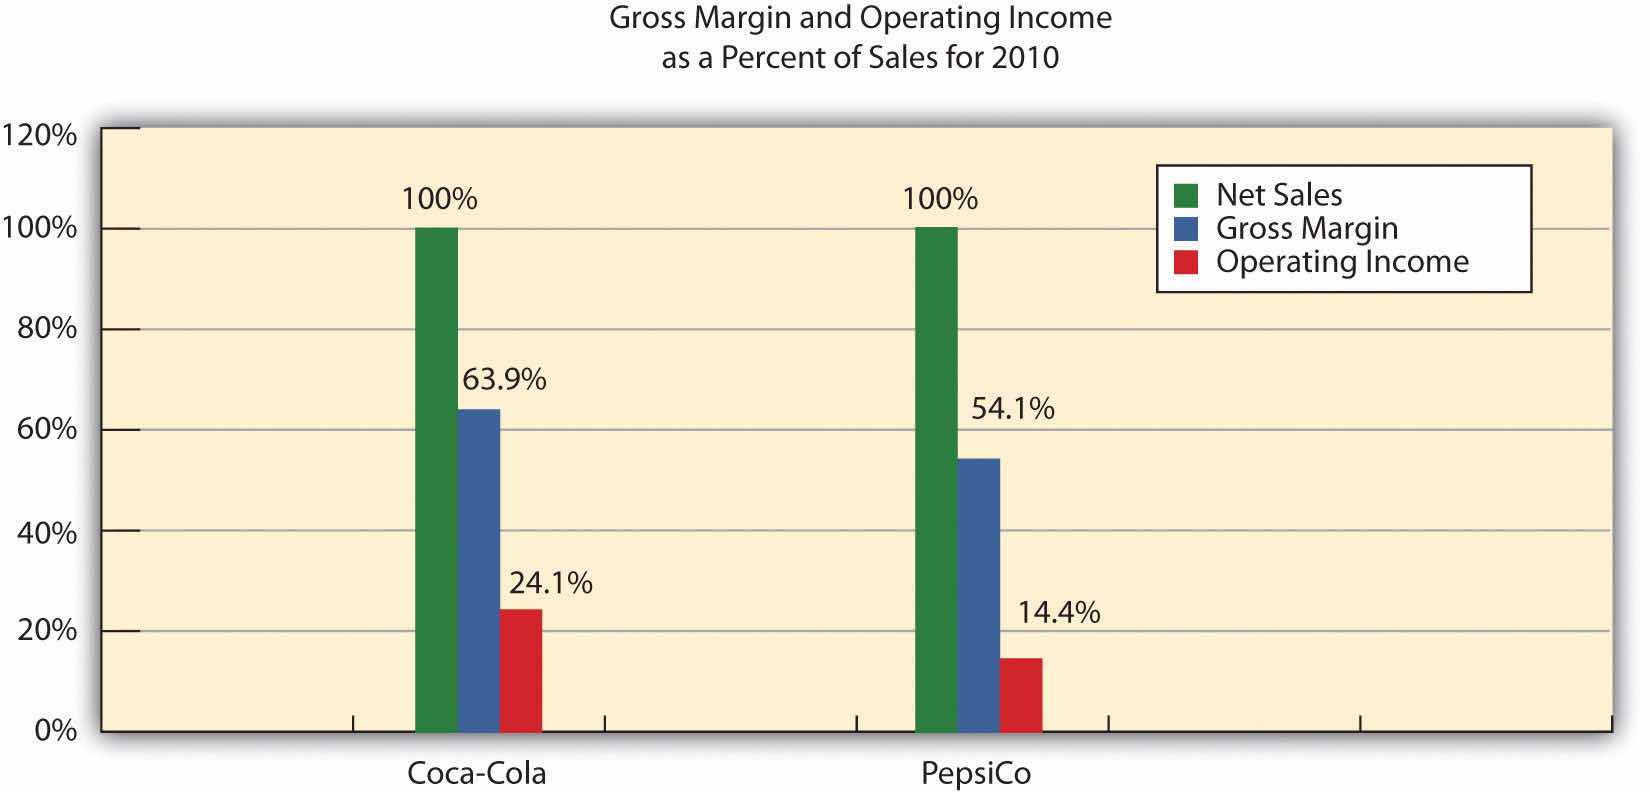
Common-size analysis enables us to compare companies on equal ground, and as this analysis shows, Coca-Cola is outperforming PepsiCo in terms of income statement information. However, as you will learn in this chapter, there are many other measures to consider before concluding that Coca-Cola is winning the financial performance battle.
Common-size analysis is obviously crucial to comparative analysis. In fact, some sources of industry data present the information exclusively in a common-size format, and most of the accounting software available today has been engineered to facilitate this type of analysis.
Common-Size Analysis Using Accounting Software
Most accounting computer programs, including QuickBooks, Peachtree, and MAS 90, provide common-size analysis reports. You simply select the appropriate report format and financial statement date, and the system prints the report. Thus accountants using this type of software can focus more on analyzing common-size information than on preparing it.
Refer to the information presented in Note 13.10 "Review Problem 13.1" for PepsiCo, and perform the following:
Solution to Review Problem 13.2
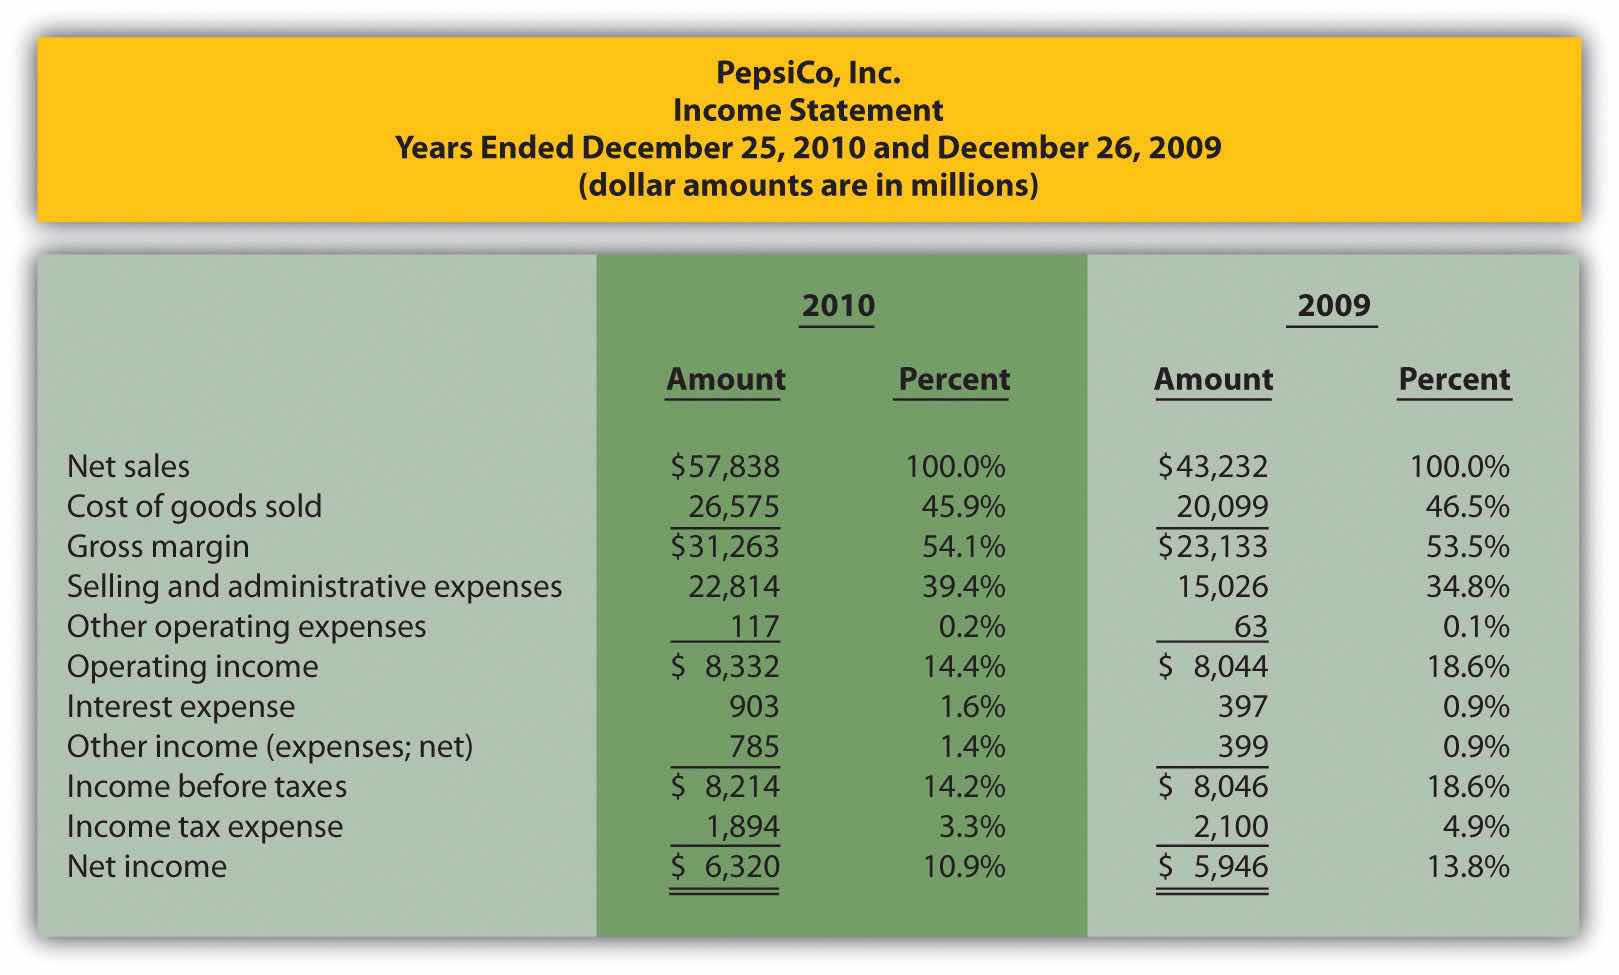
Note: All percentages use net sales as the base. For example, 2010 cost of goods sold percent of 45.9 percent equals $26,575 cost of goods sold ÷ $57,838 net sales. Note that rounding issues sometimes cause subtotals in the percent column to be off by a small amount.
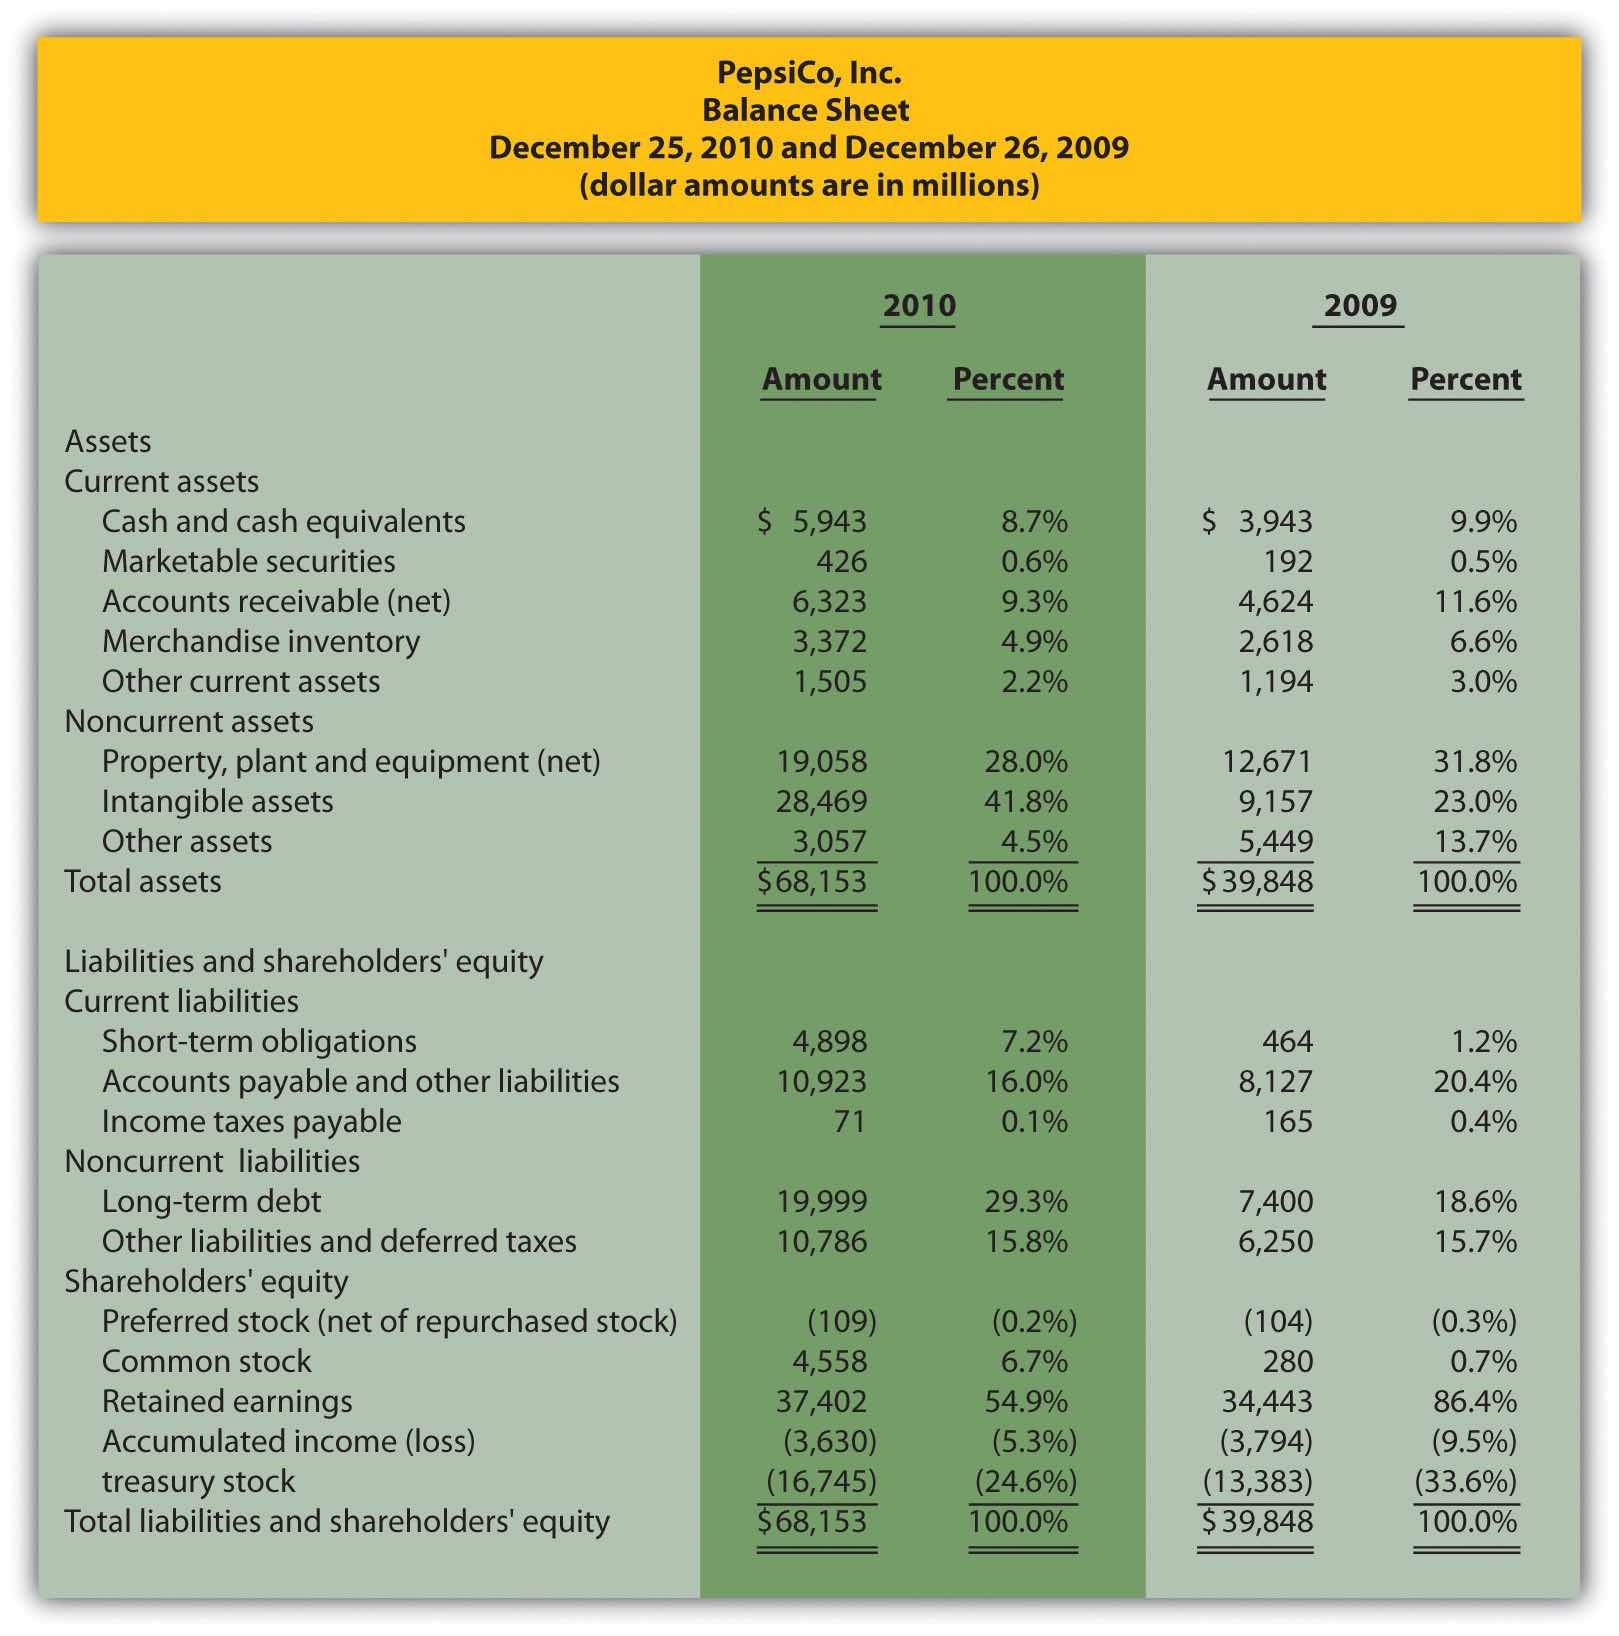
Note: All percentages use total assets or total liabilities and shareholders’ equity as the base. For example, 2010 cash and cash equivalents percent of 8.7 percent equals $5,943 ÷ $68,153. Note that rounding issues sometimes cause subtotals in the percent column to be off by a small amount.
The composition of PepsiCo’s income statement remained relatively consistent from 2009 to 2010. The most notable change occurred with selling and administrative expenses, which increased from 34.8 percent of sales in 2009 to 39.4 percent of sales in 2010. This in turn drove down operating income from 18.6 percent in 2009 to 14.4 percent in 2010. This also likely caused the decrease in income before taxes, income tax expense, and net income.
The composition of PepsiCo’s balance sheet had some significant changes from 2009 to 2010. The most notable changes occurred with intangible assets (23.0 percent in 2009 versus 41.8 percent in 2010), other assets (13.7 percent in 2009 versus 4.5 percent in 2010), short-term obligations (1.2 percent in 2009 versus 7.2 percent in 2010), long-term debt (18.6 percent in 2009 versus 29.3 percent in 2010), common stock (0.7 percent in 2009 versus 6.7 percent in 2010), and retained earnings (86.4 percent in 2009 versus 54.9 percent in 2010).