A discrete random variable
Examples of discrete random variables include:
- The number of eggs that a hen lays in a given day (it can't be 2.3)
- The number of people going to a given soccer match
- The number of students that come to class on a given day
- The number of people in line at McDonald's on a given day and time
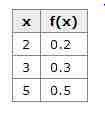
A discrete probability distribution can be described by a table, by a formula, or by a graph. For example, suppose that

Probability Histogram
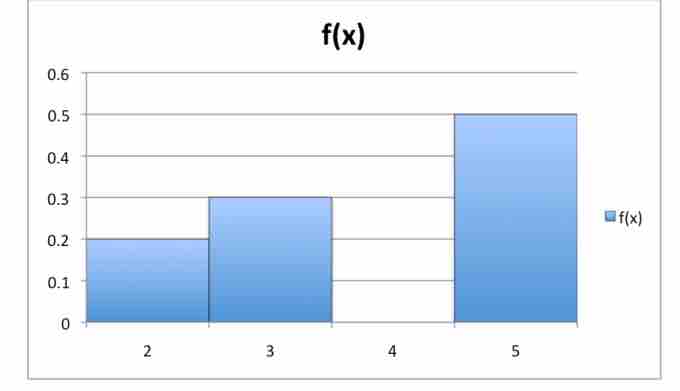
This histogram displays the probabilities of each of the three discrete random variables.
The formula, table, and probability histogram satisfy the following necessary conditions of discrete probability distributions:
-
$0 \leq f(x) \leq 1$ , i.e., the values of$f(x)$ are probabilities, hence between 0 and 1. -
$\sum f(x) = 1$ , i.e., adding the probabilities of all disjoint cases, we obtain the probability of the sample space, 1.
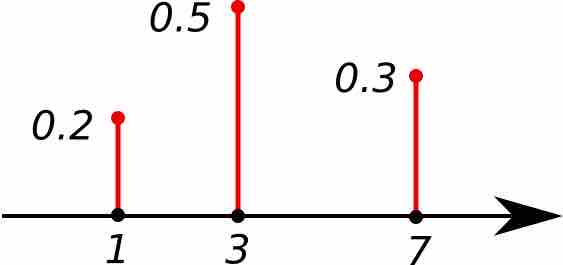
Sometimes, the discrete probability distribution is referred to as the probability mass function (pmf). The probability mass function has the same purpose as the probability histogram, and displays specific probabilities for each discrete random variable. The only difference is how it looks graphically.

Probability Mass Function
This shows the graph of a probability mass function. All the values of this function must be non-negative and sum up to 1.

Discrete Probability Distribution
This table shows the values of the discrete random variable can take on and their corresponding probabilities.