Concept
Version 6
Created by Boundless
Interpreting Distributions Constructed by Others

Truncated Bar Graph
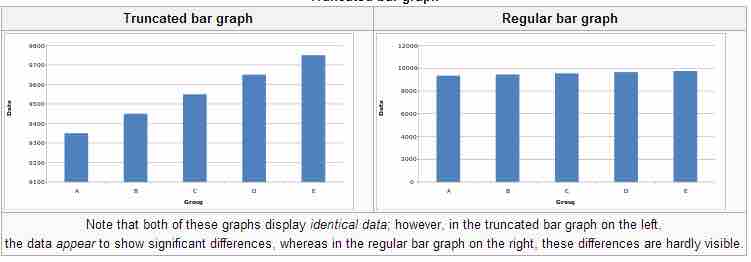
Note that both of these graphs display identical data; however, in the truncated bar graph on the left, the data appear to show significant differences, whereas in the regular bar graph on the right, these differences are hardly visible.
Source
Boundless vets and curates high-quality, openly licensed content from around the Internet. This particular resource used the following sources: