The standard error is the standard deviation of the sampling distribution of a statistic. The term may also be used to refer to an estimate of that standard deviation, derived from a particular sample used to compute the estimate.
For example, the sample mean is the usual estimator of a population mean. However, different samples drawn from that same population would in general have different values of the sample mean. The standard error of the mean (i.e., of using the sample mean as a method of estimating the population mean) is the standard deviation of those sample means over all possible samples (of a given size) drawn from the population. Secondly, the standard error of the mean can refer to an estimate of that standard deviation, computed from the sample of data being analyzed at the time.
In scientific and technical literature, experimental data is often summarized either using the mean and standard deviation or the mean with the standard error. This often leads to confusion about their interchangeability. However, the mean and standard deviation are descriptive statistics, whereas the mean and standard error describes bounds on a random sampling process. Despite the small difference in equations for the standard deviation and the standard error, this small difference changes the meaning of what is being reported from a description of the variation in measurements to a probabilistic statement about how the number of samples will provide a better bound on estimates of the population mean, in light of the central limit theorem. Put simply, standard error is an estimate of how close to the population mean your sample mean is likely to be, whereas standard deviation is the degree to which individuals within the sample differ from the sample mean. Standard error should decrease with larger sample sizes, as the estimate of the population mean improves. Standard deviation will be unaffected by sample size.

Standard Deviation
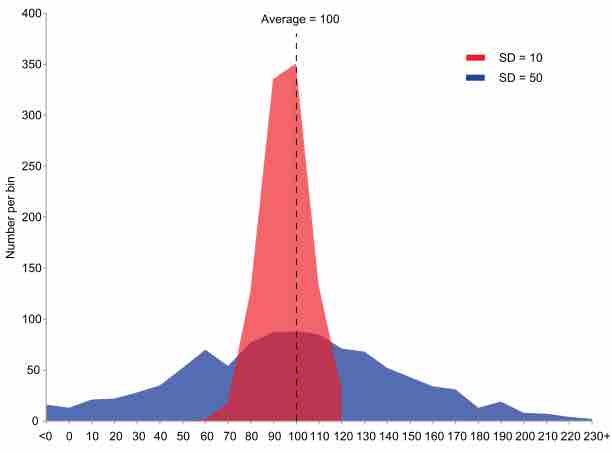
This is an example of two sample populations with the same mean and different standard deviations. The red population has mean 100 and SD 10; the blue population has mean 100 and SD 50.