Standard Deviation as Standard Error
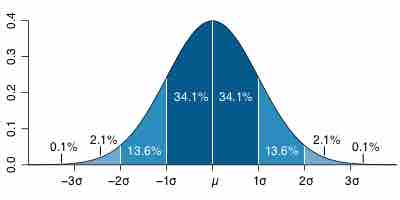
For a value that is sampled with an unbiased normally distributed error, the graph depicts the proportion of samples that would fall between 0, 1, 2, and 3 standard deviations above and below the actual value.
Source
Boundless vets and curates high-quality, openly licensed content from around the Internet. This particular resource used the following sources:
"Standard deviation diagram."
http://commons.wikimedia.org/wiki/File:Standard_deviation_diagram.svg
Wikimedia
CC BY.