Descriptive Statistics vs. Inferential Statistics
Descriptive statistics is the discipline of quantitatively describing the main features of a collection of data, or the quantitative description itself. Descriptive statistics are distinguished from inferential statistics in that descriptive statistics aim to summarize a sample, rather than use the data to learn about the population that the sample of data is thought to represent. This generally means that descriptive statistics, unlike inferential statistics, are not developed on the basis of probability theory. Even when a data analysis draws its main conclusions using inferential statistics, descriptive statistics are generally also presented. For example, in a paper reporting on a study involving human subjects, there typically appears a table giving the overall sample size, sample sizes in important subgroups (e.g., for each treatment or exposure group), and demographic or clinical characteristics such as the average age and the proportion of subjects of each sex.
Descriptive Statistics
Descriptive statistics provides simple summaries about the sample and about the observations that have been made. Such summaries may be either quantitative, i.e. summary statistics, or visual, i.e. simple-to-understand graphs. These summaries may either form the basis of the initial description of the data as part of a more extensive statistical analysis, or they may be sufficient in and of themselves for a particular investigation.
For example, the shooting percentage in basketball is a descriptive statistic that summarizes the performance of a player or a team. This number is the number of shots made divided by the number of shots taken. For example, a player who shoots 33% is making approximately one shot in every three. The percentage summarizes or describes multiple discrete events. Consider also the grade point average. This single number describes the general performance of a student across the range of their course experiences.
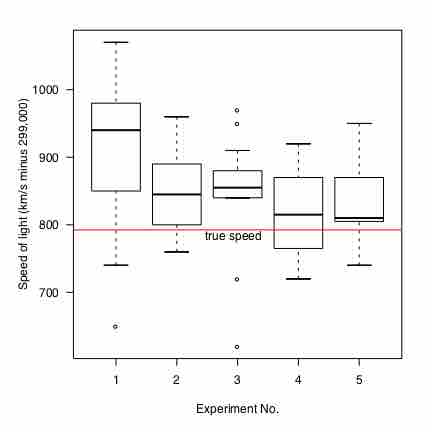
The use of descriptive and summary statistics has an extensive history and, indeed, the simple tabulation of populations and of economic data was the first way the topic of statistics appeared. More recently, a collection of summary techniques has been formulated under the heading of exploratory data analysis: an example of such a technique is the box plot .

Box Plot
The box plot is a graphical depiction of descriptive statistics.
In the business world, descriptive statistics provide a useful summary of security returns when researchers perform empirical and analytical analysis, as they give a historical account of return behavior.
Inferential Statistics
For the most part, statistical inference makes propositions about populations, using data drawn from the population of interest via some form of random sampling. More generally, data about a random process is obtained from its observed behavior during a finite period of time. Given a parameter or hypothesis about which one wishes to make inference, statistical inference most often uses a statistical model of the random process that is supposed to generate the data and a particular realization of the random process.
The conclusion of a statistical inference is a statistical proposition. Some common forms of statistical proposition are:
- an estimate; i.e., a particular value that best approximates some parameter of interest
- a confidence interval (or set estimate); i.e., an interval constructed using a data set drawn from a population so that, under repeated sampling of such data sets, such intervals would contain the true parameter value with the probability at the stated confidence level
- a credible interval; i.e., a set of values containing, for example, 95% of posterior belief
- rejection of a hypothesis
- clustering or classification of data points into groups