Hemoglobin
About 98.5% of the oxygen in a sample of arterial blood in a healthy human breathing air at sea-level pressure is bound to the hemoglobin in blood (Hgb). Hemoglobin is a protein found in red blood cells (also called erythrocytes).
There are roughly 270 million hemoglobin molecules in a single red blood cell, and each contains 4 heme groups. The function of Hgb is to provide a binding site for oxygen to carry oxygen throughout the bloodstream to the systemic tissues for cellular respiration.
Hemoglobin
Hemoglobin is the iron-containing, oxygen-transport metalloprotein in the red blood cells of all vertebrates.
About 1.5% of oxygen is physically dissolved in the other blood liquids and not connected to Hgb. It has an oxygen binding capacity between 1.36 and 1.37 ml O2 per gram Hgb.
Oxyhemoglobin Dissociation Curve
The percentage of oxygen that is saturated in the hemoglobin of blood is generally represented by a curve that shows the relationship between PaO2 and O2 saturation. Saturation of O2 in hemoglobin is an indicator for how much O2 is able to reach the tissues of the body.
Higher PaO2 means higher saturation of oxygen in blood. Under normal conditions the PaO2 in systemic blood is equal to 50%, about 26.6 mmHg,; this is called the P50.
The curve starts to plateau at PaO2 higher than 60 mmHG, meaning that increases in PaO2 after that point won't significantly increase saturation. This also means that the approximate carrying capacity for oxygen in hemoglobin has been reached and excess oxygen won't go into hemoglobin.
The carrying capacity can be increased if more hemoglobin is added to the system, such as through greater red blood cell generation in high altitude, or from blood transfusions. The lower areas of the curve show saturation when oxygen is unloaded into the tissues.

The oxyhaemoglobin dissociation curve
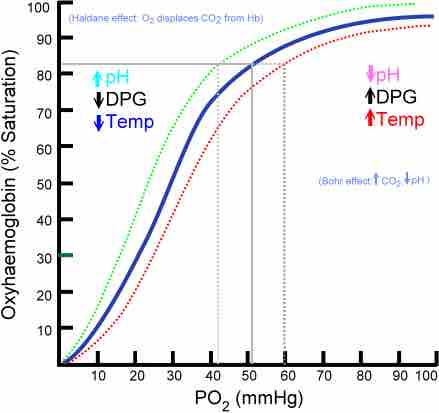
The oxygen–hemoglobin dissociation curve plots the percent hemoglobin saturation (y-axis) against the partial pressure of oxygen in the blood (PO2). The blue curve is standard curve, while the red and green curves are right and leftward shifts respectively.
The oxyhemoglobin dissociation curve can shift in response to a variety of factors. A change in the P50 of the curve is a sign that the dissociation curve as a whole has shifted. Shifts indicate a change in affinity for oxygen's binding to hemoglobin, which changes the ability of oxygen to bind to hemoglobin and stay bound to it (i.e., not be released from it).
Rightward shifts indicate a decreased affinity for the binding of hemoglobin, so that less oxygen binds to hemoglobin, and more oxygen is unloaded from it into the tissues. The curve shifts right during decreased blood pH (called the Bohr effect), increased temperature, and during exercise among other things.
Anemia (a disorder marked by a decreased red blood cell count and less hemoglobin) also causes a rightward shift, but also changes the shape of the curve so that it moves downward as well as a result of the reduced levels of hemoglobin.
Leftward shifts indicate an increased affinity for the binding of hemoglobin, so that more oxygen binds to hemoglobin, but less oxygen is unloaded from it into the tissues. Causes of leftward shifts include increased blood pH, decreased temperature, and carbon monoxide exposure. Carbon monoxide binds to hemoglobin in place of oxygen, so that less oxygen reaches the tissues; this can be fatal if severe enough.