Concept
Version 9
Created by Boundless
Competitive Dynamics

Example of Competitor Profiling
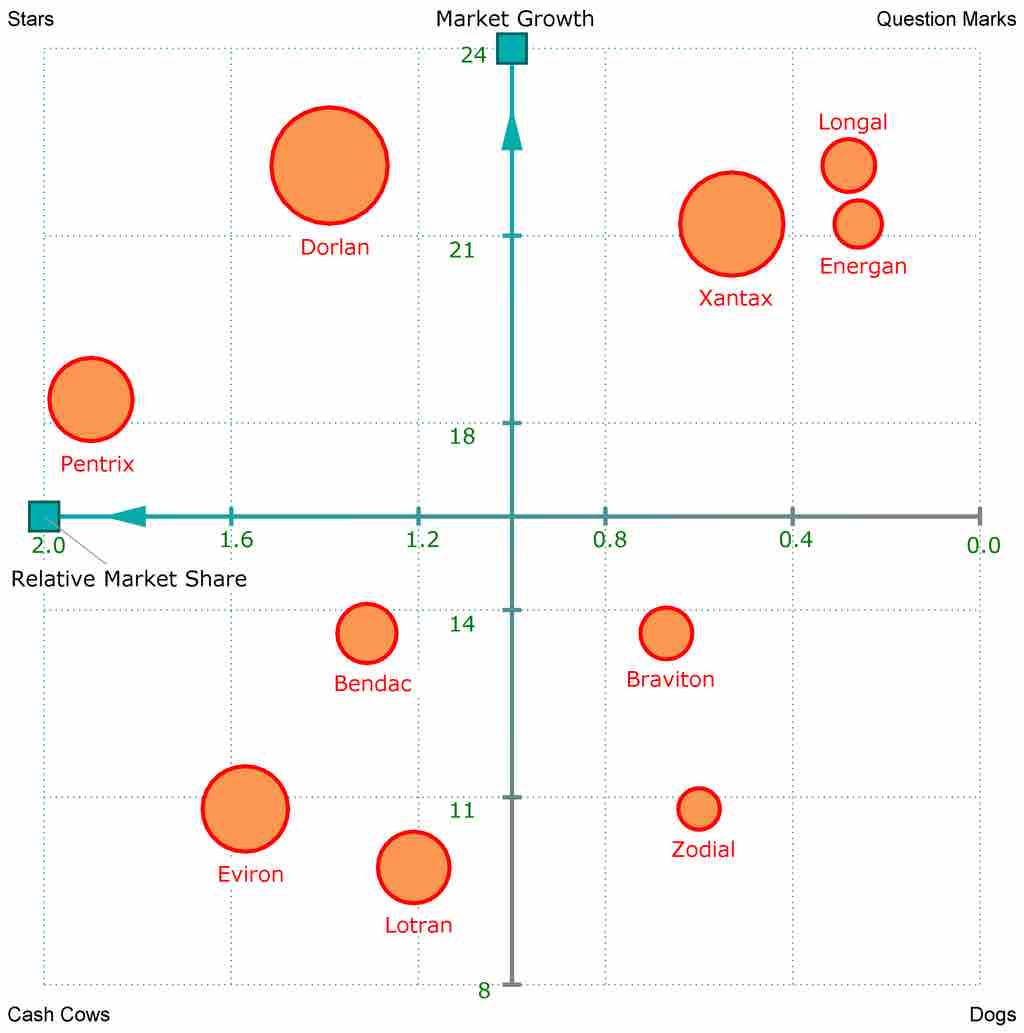
The folio plot visualizes the relative market share of a portfolio of products versus the growth of their market. The circles differ in size by their sales volume. Note that the highest-selling product, Dorian, shows the highest market growth and a high (though not the highest) market share; the lowest-selling, Zodial, shows both low market growth and low market share.
Source
Boundless vets and curates high-quality, openly licensed content from around the Internet. This particular resource used the following sources:
"Folio Plot BCG Matrix Example."
http://commons.wikimedia.org/wiki/File:Folio_Plot_BCG_Matrix_Example.png
Wikimedia
CC BY.